# Benchmark Harness Diagram Analysis
## Legend
- **User-defined**: Green (#00FF00)
- **User-customizable**: Orange dotted (#FFA500)
- **Benchmark-defined**: Pink (#FFC0CB)
## Diagram Structure
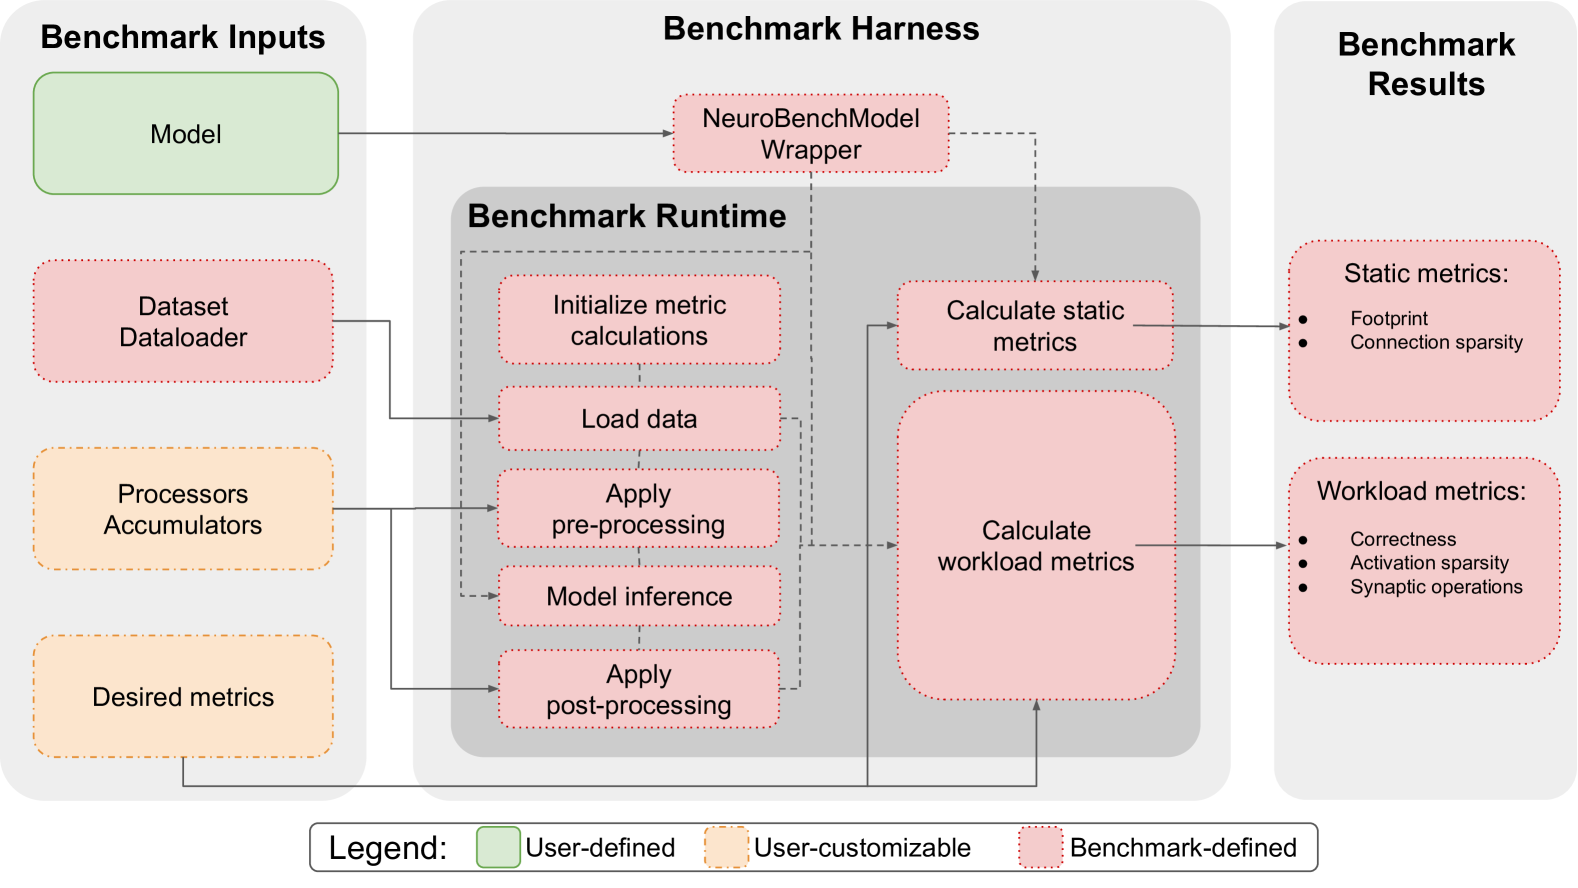
### Left Section: Benchmark Inputs
1. **Model** (User-defined, Green)
- Arrows to: `NeuroBenchModel Wrapper`
2. **Dataset Dataloader** (Benchmark-defined, Pink)
- Arrows to: `Load data` step
3. **Processors Accumulators** (User-customizable, Orange dotted)
- Arrows to: `Apply pre-processing` step
4. **Desired metrics** (User-customizable, Orange dotted)
- Arrows to: `Calculate workload metrics`
### Central Section: Benchmark Runtime
1. **NeuroBenchModel Wrapper** (Benchmark-defined, Pink)
- Connects to: `Model inference` step
2. **Steps in Runtime**:
- `Initialize metric calculations` (Benchmark-defined)
- `Load data` (Benchmark-defined)
- `Apply pre-processing` (Benchmark-defined)
- `Model inference` (Benchmark-defined)
- `Apply post-processing` (Benchmark-defined)
- `Calculate static metrics` (Benchmark-defined)
- `Calculate workload metrics` (Benchmark-defined)
### Right Section: Benchmark Results
1. **Static metrics** (Benchmark-defined, Pink)
- Sub-metrics:
- Footprint
- Connection sparsity
2. **Workload metrics** (Benchmark-defined, Pink)
- Sub-metrics:
- Correctness
- Activation sparsity
- Synaptic operations
## Flowchart Connections
1. **Input → Runtime**:
- Model → NeuroBenchModel Wrapper → Model inference
- Dataset Dataloader → Load data
- Processors Accumulators → Apply pre-processing
- Desired metrics → Calculate workload metrics
2. **Runtime → Results**:
- Calculate static metrics → Static metrics
- Calculate workload metrics → Workload metrics
## Spatial Grounding
- **Legend Position**: Bottom center
- **Color Consistency Check**:
- All green elements match "User-defined"
- All orange dotted elements match "User-customizable"
- All pink elements match "Benchmark-defined"
## Trend Verification
- No numerical data present; diagram represents process flow rather than quantitative trends.
## Component Isolation
1. **Header**: Diagram title "Benchmark Harness"
2. **Main Chart**: Three-column layout (Inputs | Runtime | Results)
3. **Footer**: Legend with color coding
## Textual Extraction
### Benchmark Inputs
- Model
- Dataset Dataloader
- Processors Accumulators
- Desired metrics
### Benchmark Runtime
- Initialize metric calculations
- Load data
- Apply pre-processing
- Model inference
- Apply post-processing
- Calculate static metrics
- Calculate workload metrics
### Benchmark Results
- Static metrics:
- Footprint
- Connection sparsity
- Workload metrics:
- Correctness
- Activation sparsity
- Synaptic operations
## Diagram Description
The flowchart illustrates a benchmarking system for neural network models. It begins with configurable inputs (model architecture, data pipeline, processing logic, and evaluation criteria), progresses through a standardized runtime environment with preprocessing, inference, and postprocessing stages, and concludes with quantitative evaluation of both computational efficiency (static metrics) and model performance (workload metrics). The system emphasizes modularity through user-defined components while maintaining benchmark-standardized measurement protocols.