TECHNICAL ASSET FINGERPRINT
80e5a6af3283e519d53661e7
Click to view fullscreen
Press ESC or click to close
FOUND IN PAPERS
EXPERT: healer-alpha-free VERSION 1
RUNTIME: free/openrouter/healer-alpha
INTEL_VERIFIED
\n
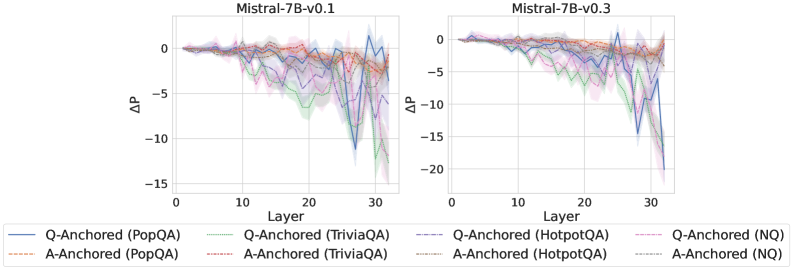
## Line Charts: Mistral-7B Model Layer-wise ΔP Analysis
### Overview
The image displays two side-by-side line charts comparing the layer-wise change in a metric (ΔP) for two versions of the Mistral-7B language model: v0.1 (left) and v0.3 (right). Each chart plots multiple data series representing different question-answering datasets, using two anchoring methods ("Q-Anchored" and "A-Anchored").
### Components/Axes
* **Chart Titles:**
* Left Chart: `Mistral-7B-v0.1`
* Right Chart: `Mistral-7B-v0.3`
* **X-Axis (Both Charts):**
* Label: `Layer`
* Scale: Linear, from 0 to 30, with major ticks at 0, 10, 20, 30.
* **Y-Axis (Both Charts):**
* Label: `ΔP` (Delta P)
* Scale: Linear.
* Left Chart (v0.1): Ranges from approximately -15 to 0.
* Right Chart (v0.3): Ranges from approximately -20 to 0.
* **Legend (Bottom, spanning both charts):**
* The legend is positioned below the two chart panels.
* It defines 8 data series using a combination of color and line style (solid vs. dashed).
* **Legend Entries (Transcribed):**
1. `Q-Anchored (PopQA)` - Solid blue line.
2. `A-Anchored (PopQA)` - Dashed orange line.
3. `Q-Anchored (TriviaQA)` - Solid green line.
4. `A-Anchored (TriviaQA)` - Dashed red line.
5. `Q-Anchored (HotpotQA)` - Solid purple line.
6. `A-Anchored (HotpotQA)` - Dashed brown line.
7. `Q-Anchored (NQ)` - Solid pink line.
8. `A-Anchored (NQ)` - Dashed gray line.
### Detailed Analysis
**Chart 1: Mistral-7B-v0.1 (Left Panel)**
* **General Trend:** All data series begin near ΔP = 0 at Layer 0. As the layer number increases, the ΔP values for all series trend downward (become more negative), indicating a decrease in the measured metric. The decline is gradual until approximately Layer 15-20, after which the lines become more volatile and show steeper drops.
* **Series-Specific Observations:**
* **Q-Anchored (PopQA) [Solid Blue]:** Shows a moderate decline, with a notable sharp dip around Layer 27-28, reaching near -12, before recovering slightly.
* **A-Anchored (PopQA) [Dashed Orange]:** Follows a smoother, less volatile downward trend compared to its Q-Anchored counterpart.
* **Q-Anchored (TriviaQA) [Solid Green]:** Exhibits one of the most significant declines, with a steep drop starting around Layer 20 and reaching the lowest point on this chart, approximately -14, near Layer 30.
* **A-Anchored (TriviaQA) [Dashed Red]:** Declines steadily but remains less negative than the Q-Anchored version.
* **Q-Anchored (HotpotQA) [Solid Purple]:** Shows high volatility in the later layers (25-30), with multiple sharp peaks and troughs.
* **A-Anchored (HotpotQA) [Dashed Brown]:** Follows a relatively smooth downward path.
* **Q-Anchored (NQ) [Solid Pink]:** Declines steadily, clustering with several other lines in the mid-range of negativity.
* **A-Anchored (NQ) [Dashed Gray]:** Similar to other A-Anchored series, showing a smoother decline.
**Chart 2: Mistral-7B-v0.3 (Right Panel)**
* **General Trend:** Similar to v0.1, all series start near 0 and trend downward. However, the magnitude of the negative ΔP is generally larger in v0.3, especially in the final layers (25-30), where the Y-axis extends to -20. The volatility in the later layers appears more pronounced.
* **Series-Specific Observations:**
* **Q-Anchored (PopQA) [Solid Blue]:** Displays extreme volatility after Layer 25, with a dramatic plunge to approximately -18 around Layer 29, the single lowest point visible in either chart.
* **A-Anchored (PopQA) [Dashed Orange]:** Shows a more consistent decline than in v0.1 but still exhibits more late-layer volatility.
* **Q-Anchored (TriviaQA) [Solid Green]:** Again shows a very steep decline, dropping below -15 after Layer 25.
* **A-Anchored (TriviaQA) [Dashed Red]:** Follows a downward trend, less severe than the Q-Anchored line.
* **Q-Anchored (HotpotQA) [Solid Purple]:** Highly volatile in the final quarter of the layers, with sharp oscillations.
* **A-Anchored (HotpotQA) [Dashed Brown]:** Shows a clear downward trend with moderate volatility.
* **Q-Anchored (NQ) [Solid Pink]:** Declines significantly, clustering with the other Q-Anchored lines in the deep negative region.
* **A-Anchored (NQ) [Dashed Gray]:** Shows a steady decline, generally less negative than the Q-Anchored NQ line.
### Key Observations
1. **Version Comparison:** The ΔP metric becomes more negative and exhibits greater volatility in the later layers (20-30) for model version v0.3 compared to v0.1.
2. **Anchoring Method Effect:** Across all datasets and both model versions, the **Q-Anchored** variants (solid lines) consistently show more negative ΔP values and higher volatility in deeper layers than their **A-Anchored** (dashed line) counterparts.
3. **Dataset Sensitivity:** The **TriviaQA** (green lines) and **PopQA** (blue lines) datasets, particularly when Q-Anchored, appear most sensitive, showing the largest negative ΔP values. The **NQ** and **HotpotQA** datasets show significant but slightly less extreme changes.
4. **Layer-wise Pattern:** The metric is relatively stable in early layers (0-15), begins to diverge and decline in middle layers (15-25), and shows the most dramatic changes and instability in the final layers (25-30).
### Interpretation
This visualization likely analyzes how internal model representations or behaviors change across layers for different factual question-answering tasks. The metric **ΔP** probably represents a change in probability, performance, or some probing metric between a baseline and a condition.
* **What the data suggests:** The consistent negative trend indicates that as information propagates through the model's layers, the measured property (ΔP) decreases. The greater negativity in v0.3 suggests this effect is amplified in the newer model version.
* **Relationship between elements:** The stark contrast between Q-Anchored and A-Anchored lines is the most critical finding. It implies that the model's processing or representation of the *question* (Q) leads to a more significant shift in the measured metric across layers than processing the *answer* (A). This could point to differences in how the model encodes or utilizes query versus answer information hierarchically.
* **Notable anomalies:** The extreme, sharp drops for Q-Anchored PopQA and TriviaQA in the final layers of v0.3 are significant outliers. They may indicate specific layers where the model's processing for these question types undergoes a drastic transformation or where the probing metric becomes particularly sensitive.
* **Why it matters:** This layer-wise analysis provides a "microscopic" view of model internals. It helps researchers understand not just *if* a model knows something, but *how* and *where* that knowledge is processed and transformed. The differences between model versions (v0.1 vs. v0.3) and anchoring methods offer clues for model debugging, interpretability, and understanding the impact of architectural or training changes.
DECODING INTELLIGENCE...