## Line Graph: ΔP vs. Layer for Mistral-7B Models v0.1 and v0.3
### Overview
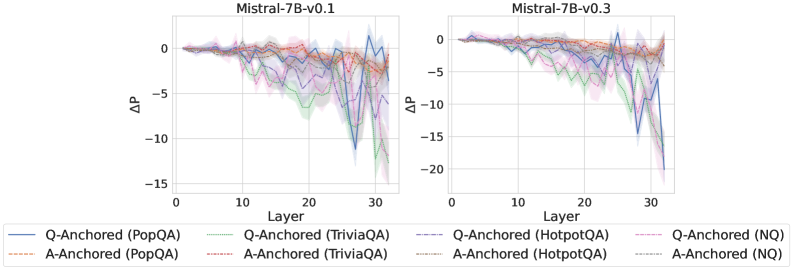
The image contains two side-by-side line graphs comparing the performance of different anchoring methods (Q-Anchored and A-Anchored) across layers (0–30) in two versions of the Mistral-7B model (v0.1 and v0.3). The y-axis represents ΔP (change in performance), and the x-axis represents model layers. Each graph includes multiple data series with distinct line styles and colors, representing combinations of anchoring methods and datasets (e.g., PopQA, TriviaQA, HotpotQA, NQ).
### Components/Axes
- **Y-Axis**: ΔP (change in performance), ranging from -20 to 0.
- **X-Axis**: Layer (0–30), representing model depth.
- **Legends**:
- **Left Panel (v0.1)**:
- Solid blue: Q-Anchored (PopQA)
- Dashed green: Q-Anchored (TriviaQA)
- Dotted red: A-Anchored (PopQA)
- Dash-dot purple: A-Anchored (TriviaQA)
- **Right Panel (v0.3)**:
- Solid blue: Q-Anchored (HotpotQA)
- Dashed green: Q-Anchored (NQ)
- Dotted red: A-Anchored (HotpotQA)
- Dash-dot purple: A-Anchored (NQ)
- **Shaded Regions**: Error margins or confidence intervals around each line.
### Detailed Analysis
#### Left Panel (Mistral-7B-v0.1):
1. **Q-Anchored (PopQA)**: Solid blue line starts near 0, dips sharply to ~-15 at layer 15, then fluctuates upward.
2. **Q-Anchored (TriviaQA)**: Dashed green line remains relatively stable, with minor dips to ~-5.
3. **A-Anchored (PopQA)**: Dotted red line shows gradual decline to ~-10, with a sharp drop at layer 25.
4. **A-Anchored (TriviaQA)**: Dash-dot purple line fluctuates minimally, staying near 0.
#### Right Panel (Mistral-7B-v0.3):
1. **Q-Anchored (HotpotQA)**: Solid blue line starts near 0, dips to ~-10 at layer 10, then stabilizes.
2. **Q-Anchored (NQ)**: Dashed green line shows erratic fluctuations, peaking at ~-5 and dropping to ~-15 at layer 30.
3. **A-Anchored (HotpotQA)**: Dotted red line declines steadily to ~-15, with a sharp drop at layer 25.
4. **A-Anchored (NQ)**: Dash-dot purple line remains stable, with minor dips to ~-5.
### Key Observations
- **Layer-Specific Variability**: Sharp drops (e.g., layer 15 in v0.1, layer 25 in v0.3) suggest critical layer interactions affecting ΔP.
- **Dataset Impact**: Methods using HotpotQA and NQ datasets exhibit larger ΔP fluctuations compared to PopQA and TriviaQA.
- **Model Version Differences**: v0.3 shows more pronounced dips in A-Anchored methods, indicating architectural changes.
- **Error Margins**: Shaded regions highlight inconsistency in Q-Anchored (NQ) and A-Anchored (HotpotQA) across layers.
### Interpretation
The data suggests that anchoring methods significantly influence ΔP, with dataset choice and model version amplifying these effects. For example:
- **Q-Anchored (PopQA)** in v0.1 shows the most drastic performance drop, possibly due to layer-specific dependencies.
- **A-Anchored (HotpotQA)** in v0.3 exhibits the largest cumulative ΔP decline, hinting at architectural sensitivity in deeper layers.
- The stability of TriviaQA and NQ in A-Anchored methods suggests robustness in certain configurations.
The shaded regions indicate that performance variability is dataset-dependent, with HotpotQA and NQ showing higher uncertainty. These trends may reflect differences in question complexity or answer diversity across datasets. Further investigation into layer-specific mechanisms (e.g., attention patterns) could clarify these effects.