## Bar Chart: Speedup Comparison of Naïve, GSE, and VSE
### Overview
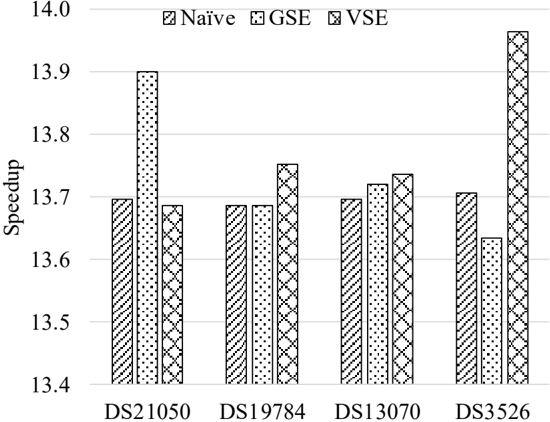
The image is a bar chart comparing the speedup achieved by three different methods (Naïve, GSE, and VSE) across four datasets (DS21050, DS19784, DS13070, and DS3526). The chart displays speedup values ranging from approximately 13.4 to 14.0.
### Components/Axes
* **Y-axis:** "Speedup", with a numerical scale ranging from 13.4 to 14.0 in increments of 0.1.
* **X-axis:** Categorical axis representing the datasets: DS21050, DS19784, DS13070, and DS3526.
* **Legend:** Located at the top of the chart, indicating the representation of each method:
* Naïve (represented by bars with diagonal lines)
* GSE (represented by bars with dots)
* VSE (represented by bars with crosses)
### Detailed Analysis
Here's a breakdown of the speedup values for each dataset and method:
* **DS21050:**
* Naïve: Approximately 13.7
* GSE: Approximately 13.9
* VSE: Approximately 13.7
* **DS19784:**
* Naïve: Approximately 13.7
* GSE: Approximately 13.7
* VSE: Approximately 13.75
* **DS13070:**
* Naïve: Approximately 13.7
* GSE: Approximately 13.7
* VSE: Approximately 13.73
* **DS3526:**
* Naïve: Approximately 13.7
* GSE: Approximately 13.6
* VSE: Approximately 13.95
### Key Observations
* For DS21050, GSE shows a significantly higher speedup compared to Naïve and VSE.
* For DS19784 and DS13070, the speedup values for all three methods are very close.
* For DS3526, VSE shows a significantly higher speedup compared to Naïve and GSE.
### Interpretation
The chart suggests that the performance of Naïve, GSE, and VSE varies depending on the dataset. GSE performs best on DS21050, while VSE performs best on DS3526. For DS19784 and DS13070, the performance of all three methods is relatively similar. This indicates that the optimal method for achieving the highest speedup is dataset-dependent.