\n
## Bar Chart: Speedup Comparison of Naive, GSE, and VSE
### Overview
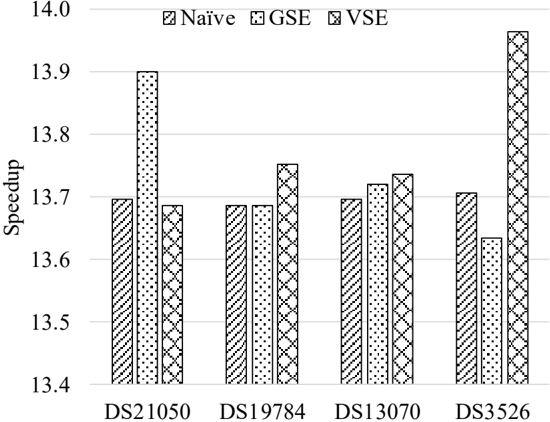
This image presents a bar chart comparing the speedup achieved by three different methods – Naive, GSE (likely Gradient Symbol Embedding), and VSE (likely Vector Symbol Embedding) – across four different datasets: DS21050, DS19784, DS13070, and DS3526. The y-axis represents "Speedup," and the x-axis represents the dataset names. Each dataset has three bars representing the speedup for each method.
### Components/Axes
* **Y-axis:** "Speedup" ranging from 13.4 to 14.0, with tick marks at 13.4, 13.5, 13.6, 13.7, 13.8, and 13.9.
* **X-axis:** Dataset names: DS21050, DS19784, DS13070, DS3526.
* **Legend:** Located at the top-right corner, associating colors/patterns with methods:
* Naive: Diagonal lines (pattern)
* GSE: Horizontal lines and dots (pattern)
* VSE: Vertical lines (pattern)
### Detailed Analysis
Let's analyze each dataset and method:
* **DS21050:**
* Naive: Approximately 13.72 speedup.
* GSE: Approximately 13.92 speedup.
* VSE: Approximately 13.7 speedup.
* **DS19784:**
* Naive: Approximately 13.68 speedup.
* GSE: Approximately 13.76 speedup.
* VSE: Approximately 13.7 speedup.
* **DS13070:**
* Naive: Approximately 13.72 speedup.
* GSE: Approximately 13.74 speedup.
* VSE: Approximately 13.73 speedup.
* **DS3526:**
* Naive: Approximately 13.72 speedup.
* GSE: Approximately 13.66 speedup.
* VSE: Approximately 13.93 speedup.
**Trends:**
* For DS21050, GSE shows the highest speedup, followed by VSE and then Naive.
* For DS19784, GSE shows the highest speedup, followed by VSE and then Naive.
* For DS13070, the speedups are very close for all three methods.
* For DS3526, VSE shows the highest speedup, followed by Naive and then GSE.
### Key Observations
* GSE consistently performs well, achieving the highest speedup in two out of the four datasets.
* VSE shows the highest speedup in DS3526, indicating its effectiveness on this particular dataset.
* The speedup values are relatively close across all methods for DS13070, suggesting that the choice of method may not be critical for this dataset.
* The speedup values are all within a narrow range (approximately 13.66 to 13.93), indicating that all three methods provide significant speedup compared to a baseline.
### Interpretation
The chart demonstrates the performance of three different methods (Naive, GSE, and VSE) in terms of speedup across four different datasets. The results suggest that the optimal method depends on the specific dataset. GSE generally performs well, while VSE excels on DS3526. The relatively small differences in speedup for DS13070 suggest that the dataset characteristics may not be conducive to significant performance gains from any of the methods.
The consistent speedup across all methods indicates that they are all effective in improving performance compared to a baseline. The variations in speedup highlight the importance of selecting the appropriate method based on the characteristics of the data. Further investigation into the nature of DS3526 could reveal why VSE performs particularly well on this dataset. The chart provides valuable insights for choosing the most efficient method for a given task, considering the specific dataset being used.