## Bar Chart: Speedup Comparison Across Datasets
### Overview
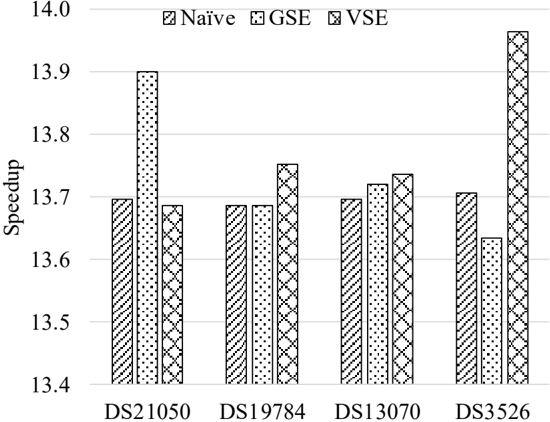
This is a grouped bar chart comparing the "Speedup" performance of three different methods (Naïve, GSE, VSE) across four distinct datasets (DS21050, DS19784, DS13070, DS3526). The chart uses patterned fills to distinguish the methods.
### Components/Axes
* **Y-Axis:** Labeled "Speedup". The scale is linear, ranging from 13.4 to 14.0, with major tick marks at 0.1 intervals (13.4, 13.5, 13.6, 13.7, 13.8, 13.9, 14.0).
* **X-Axis:** Represents four categorical datasets. From left to right: `DS21050`, `DS19784`, `DS13070`, `DS3526`.
* **Legend:** Positioned at the top center of the chart area. It defines three data series:
* **Naïve:** Represented by bars with a diagonal stripe pattern (///).
* **GSE:** Represented by bars with a dotted pattern (・・・).
* **VSE:** Represented by bars with a cross-hatch pattern (XXX).
* **Data Series:** For each dataset on the x-axis, there is a cluster of three bars, ordered from left to right as: Naïve, GSE, VSE.
### Detailed Analysis
**Trend Verification & Data Point Extraction (Approximate Values):**
1. **Dataset: DS21050**
* **Naïve (///):** Bar height is approximately **13.70**.
* **GSE (・・・):** This is the tallest bar in this group. Height is approximately **13.90**.
* **VSE (XXX):** Bar height is approximately **13.68**.
* *Trend:* GSE shows a significant speedup advantage over Naïve and VSE for this dataset.
2. **Dataset: DS19784**
* **Naïve (///):** Bar height is approximately **13.68**.
* **GSE (・・・):** Bar height is approximately **13.69**.
* **VSE (XXX):** This is the tallest bar in this group. Height is approximately **13.75**.
* *Trend:* All three methods perform similarly, with VSE having a slight edge.
3. **Dataset: DS13070**
* **Naïve (///):** Bar height is approximately **13.70**.
* **GSE (・・・):** Bar height is approximately **13.72**.
* **VSE (XXX):** This is the tallest bar in this group. Height is approximately **13.74**.
* *Trend:* A very gradual, step-wise increase in speedup from Naïve to GSE to VSE.
4. **Dataset: DS3526**
* **Naïve (///):** Bar height is approximately **13.71**.
* **GSE (・・・):** This is the shortest bar in this group. Height is approximately **13.64**.
* **VSE (XXX):** This is the tallest bar in the entire chart. Height is approximately **13.96**.
* *Trend:* VSE demonstrates a dramatic performance lead, while GSE underperforms compared to the other two methods for this dataset.
### Key Observations
* **Highest Value:** The VSE method on dataset DS3526 achieves the highest observed speedup (~13.96).
* **Lowest Value:** The GSE method on dataset DS3526 shows the lowest observed speedup (~13.64).
* **Consistency:** The Naïve method shows the most consistent performance, with all its values tightly clustered between ~13.68 and 13.71.
* **Variability:** The GSE and VSE methods show high variability. GSE is best for DS21050 but worst for DS3526. VSE is best for DS3526 and DS13070/DS19784 but worst for DS21050.
* **No Universal Winner:** No single method (Naïve, GSE, VSE) is the top performer across all four datasets.
### Interpretation
The chart demonstrates that the relative performance (speedup) of the Naïve, GSE, and VSE methods is **highly dependent on the specific dataset** being processed. This suggests that the underlying characteristics of each dataset (e.g., size, structure, complexity) interact differently with the optimizations or algorithms inherent to each method.
* **GSE** appears to be highly optimized for the type of data or workload represented by **DS21050**, yielding a substantial speedup.
* **VSE** shows exceptional performance on **DS3526**, indicating it may handle the specific challenges of that dataset very effectively. Its strong performance on DS19784 and DS13070 also suggests robustness.
* The **Naïve** method serves as a stable baseline. Its lack of variation implies it is less sensitive to dataset differences but also misses out on significant optimization opportunities that GSE and VSE can exploit in favorable conditions.
* The poor performance of **GSE on DS3526** is a notable outlier, suggesting a potential mismatch between that method's approach and the dataset's properties, or perhaps an implementation issue specific to that case.
**Conclusion:** The choice of method should be guided by the target dataset. For predictable, consistent performance, Naïve is reliable. For potential high gains, one must benchmark GSE and VSE against the specific data of interest, as their superiority is not universal.