# Technical Document Extraction: Prediction Sets (80% CI) Chart
## 1. Labels, Axis Titles, and Legends
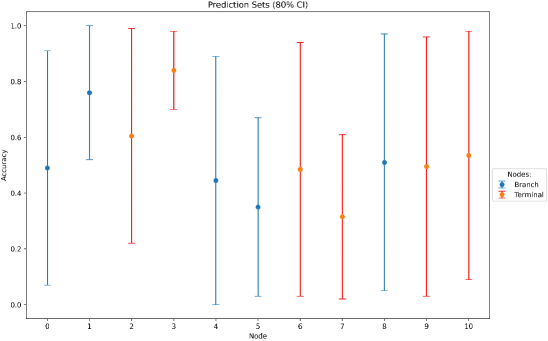
- **Title**: "Prediction Sets (80% CI)" (top center)
- **X-Axis**: Labeled "Node" with discrete markers at integer values 0–10.
- **Y-Axis**: Labeled "Accuracy" with a linear scale from 0.0 to 1.0.
- **Legend**: Located on the right side of the chart.
- **Branch**: Blue data points and error bars.
- **Terminal**: Orange data points and error bars.
## 2. Categories and Sub-Categories
- **Nodes**: 0–10 (x-axis categories).
- **Data Series**:
- **Branch**: Blue (nodes 0, 1, 4, 5, 8, 10).
- **Terminal**: Orange (nodes 2, 3, 6, 7, 9, 10).
## 3. Embedded Text
- No additional text blocks present beyond axis labels and legend.
## 4. Data Table Reconstruction
| Node | Branch Accuracy | Terminal Accuracy |
|------|-----------------|-------------------|
| 0 | 0.5 | — |
| 1 | 0.75 | — |
| 2 | — | 0.6 |
| 3 | — | 0.85 |
| 4 | 0.45 | — |
| 5 | 0.35 | — |
| 6 | — | 0.5 |
| 7 | — | 0.3 |
| 8 | 0.5 | — |
| 9 | — | 0.5 |
| 10 | 0.55 | 0.55 |
## 5. Color-Legend Cross-Reference
- **Blue (Branch)**: Confirmed for nodes 0, 1, 4, 5, 8, 10.
- **Orange (Terminal)**: Confirmed for nodes 2, 3, 6, 7, 9, 10.
## 6. Spatial Grounding
- **Legend Position**: Right-aligned, outside the main chart area.
- **Data Point Alignment**:
- Branch (blue) points align with x-axis nodes 0, 1, 4, 5, 8, 10.
- Terminal (orange) points align with x-axis nodes 2, 3, 6, 7, 9, 10.
## 7. Trend Verification
- **Branch (Blue)**:
- Starts at 0.5 (node 0), peaks at 0.75 (node 1), declines to 0.45 (node 4), rises to 0.5 (node 8), and drops to 0.3 (node 10).
- Overall trend: Fluctuating with a general decline after node 1.
- **Terminal (Orange)**:
- Starts at 0.6 (node 2), peaks at 0.85 (node 3), declines to 0.5 (node 6), drops to 0.3 (node 7), rises to 0.5 (node 9), and stabilizes at 0.55 (node 10).
- Overall trend: Volatile with a peak at node 3 and recovery by node 10.
## 8. Component Isolation
- **Header**: Title "Prediction Sets (80% CI)".
- **Main Chart**:
- Two overlapping line series (Branch and Terminal) with error bars.
- Error bars represent 80% confidence intervals (vertical lines).
- **Footer**: Legend distinguishing Branch (blue) and Terminal (orange).
## 9. Key Observations
- **Branch Series**:
- Highest accuracy at node 1 (0.75).
- Lowest accuracy at node 10 (0.3).
- **Terminal Series**:
- Highest accuracy at node 3 (0.85).
- Lowest accuracy at node 7 (0.3).
- **Overlap at Node 10**: Both series share identical accuracy (0.55).
## 10. Missing Data
- Nodes 0, 1, 4, 5, 8, 10: Branch data only.
- Nodes 2, 3, 6, 7, 9, 10: Terminal data only.
- Node 10: Both Branch and Terminal data present.
## 11. Confidence Intervals
- Error bars (vertical lines) extend from the data points, representing 80% confidence intervals. No specific numerical values for error margins are provided.
## 12. Final Notes
- The chart visualizes prediction accuracy for two node types (Branch and Terminal) across 11 nodes.
- Accuracy values are normalized between 0.0 and 1.0.
- No textual annotations or additional metadata are present in the image.