# Technical Document Extraction: Prediction Sets (80% CI)
## 1. Document Metadata
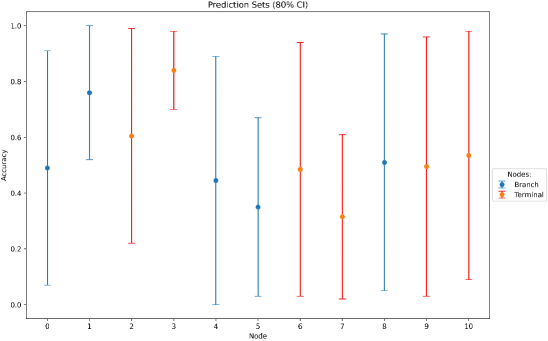
* **Title:** Prediction Sets (80% CI)
* **Primary Language:** English
* **Chart Type:** Error Bar Plot (Point estimates with Confidence Intervals)
* **X-Axis Label:** Node
* **Y-Axis Label:** Accuracy
* **Legend Title:** Nodes:
* **Legend Categories:**
* **Branch:** Represented by Blue dots and Blue error bars.
* **Terminal:** Represented by Orange dots and Red error bars.
## 2. Spatial Grounding and Component Isolation
* **Header:** Contains the title "Prediction Sets (80% CI)".
* **Main Chart Area:** Occupies the central region, plotting Accuracy (0.0 to 1.0) against Node index (0 to 10).
* **Legend Location:** Positioned on the right-hand side, vertically centered relative to the plot area.
* **Data Series Identification:**
* **Blue Series (Branch):** Nodes 0, 1, 4, 5, 8.
* **Orange/Red Series (Terminal):** Nodes 2, 3, 6, 7, 9, 10.
## 3. Data Extraction and Trend Analysis
### Trend Verification
* **Branch Nodes:** The accuracy for branch nodes is highly volatile, ranging from approximately 0.35 to 0.75. The confidence intervals for these nodes are generally very wide, often spanning nearly the entire 0.0 to 1.0 range (e.g., Nodes 0, 4, 8).
* **Terminal Nodes:** These nodes show a moderate range of accuracy (approx. 0.3 to 0.85). Node 3 stands out with the highest accuracy and the narrowest confidence interval in the entire set. Other terminal nodes (6, 9, 10) show very wide confidence intervals similar to the branch nodes.
### Data Table (Estimated Values)
The following table transcribes the visual data points. Values are estimated based on the axis scales.
| Node | Type | Accuracy (Point) | CI Lower Bound | CI Upper Bound |
| :--- | :--- | :--- | :--- | :--- |
| 0 | Branch | ~0.49 | ~0.07 | ~0.91 |
| 1 | Branch | ~0.76 | ~0.52 | ~1.00 |
| 2 | Terminal | ~0.61 | ~0.22 | ~0.99 |
| 3 | Terminal | ~0.84 | ~0.70 | ~0.98 |
| 4 | Branch | ~0.45 | ~0.00 | ~0.89 |
| 5 | Branch | ~0.35 | ~0.03 | ~0.67 |
| 6 | Terminal | ~0.49 | ~0.03 | ~0.94 |
| 7 | Terminal | ~0.32 | ~0.02 | ~0.61 |
| 8 | Branch | ~0.51 | ~0.05 | ~0.97 |
| 9 | Terminal | ~0.50 | ~0.03 | ~0.96 |
| 10 | Terminal | ~0.54 | ~0.09 | ~0.98 |
## 4. Key Observations
* **Highest Accuracy:** Node 3 (Terminal) at ~0.84.
* **Lowest Accuracy:** Node 7 (Terminal) at ~0.32.
* **Precision:** Node 3 has the most precise prediction (smallest error bar).
* **Uncertainty:** Nodes 0, 4, 8 (Branch) and 2, 6, 9, 10 (Terminal) exhibit extreme uncertainty, with 80% confidence intervals covering roughly 80-90% of the possible accuracy range.
* **Boundary Hits:** Node 1 (Branch) upper CI reaches the 1.0 limit. Node 4 (Branch) lower CI reaches the 0.0 limit.