## Line Chart: Model Performance Comparison
### Overview
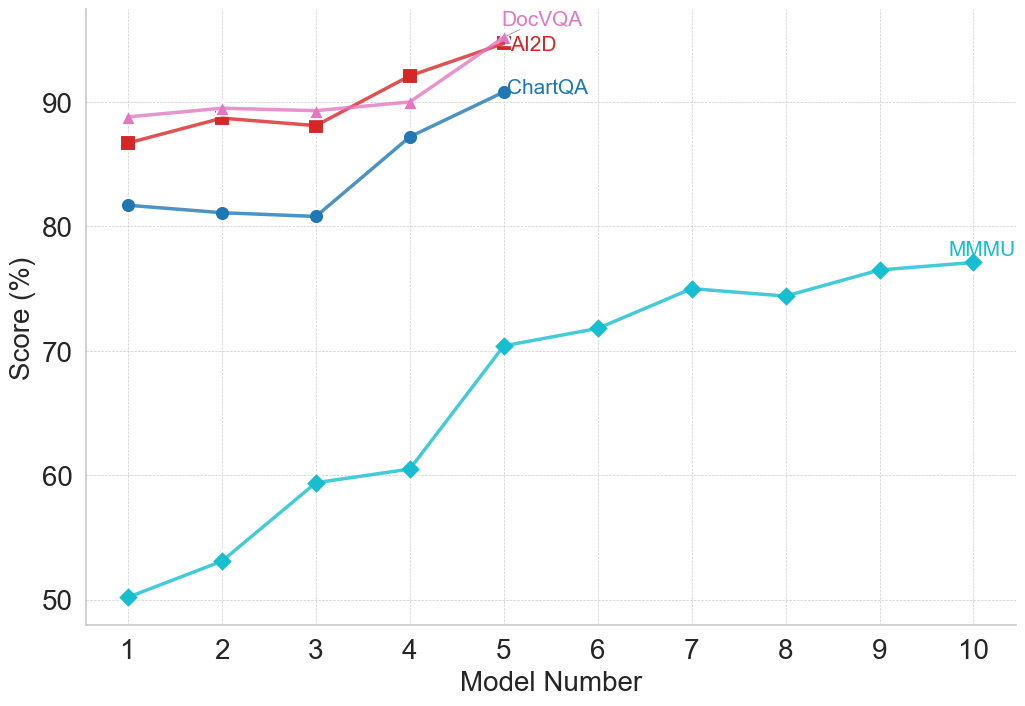
The image is a line chart comparing the performance of four different models (DocVQA, AI2D, ChartQA, and MMMU) across ten iterations or variations, labeled as "Model Number" from 1 to 10. The y-axis represents the "Score (%)", ranging from 50 to 90. The chart visually displays how the scores of each model change as the model number increases.
### Components/Axes
* **X-axis:** "Model Number", with tick marks at integers from 1 to 10.
* **Y-axis:** "Score (%)", ranging from 50 to 90. Tick marks are not explicitly labeled, but implied at intervals of 10.
* **Legend:** Located at the top of the chart, associating each model with a specific color and marker:
* **DocVQA:** Pink line with triangle markers.
* **AI2D:** Red line with square markers.
* **ChartQA:** Blue line with circle markers.
* **MMMU:** Light blue line with diamond markers.
### Detailed Analysis
* **DocVQA (Pink, Triangles):**
* Trend: Relatively stable performance, with a slight increase towards the end.
* Model 1: ~89%
* Model 2: ~89%
* Model 3: ~89%
* Model 4: ~90%
* Model 5: ~93%
* Model 10: Not explicitly shown, but the line appears to be slightly above 93%.
* **AI2D (Red, Squares):**
* Trend: Relatively stable performance, with a more pronounced increase towards the end.
* Model 1: ~87%
* Model 2: ~89%
* Model 3: ~89%
* Model 4: ~88%
* Model 5: ~92%
* Model 10: Not explicitly shown, but the line appears to be slightly above 93%.
* **ChartQA (Blue, Circles):**
* Trend: Starts relatively high, dips slightly, then increases significantly.
* Model 1: ~82%
* Model 2: ~81%
* Model 3: ~81%
* Model 4: ~87%
* Model 5: ~91%
* Model 10: Not explicitly shown, but the line appears to be slightly above 91%.
* **MMMU (Light Blue, Diamonds):**
* Trend: Consistently increasing performance across all model numbers.
* Model 1: ~50%
* Model 2: ~53%
* Model 3: ~59%
* Model 4: ~61%
* Model 5: ~70%
* Model 6: ~72%
* Model 7: ~75%
* Model 8: ~74%
* Model 9: ~77%
* Model 10: ~77%
### Key Observations
* DocVQA and AI2D models show similar performance, with AI2D having a slightly lower score at the beginning but catching up by Model 5.
* ChartQA starts with a relatively high score but is overtaken by DocVQA and AI2D by Model 5.
* MMMU starts with the lowest score but shows the most consistent improvement across all model numbers, although it remains significantly lower than the other models.
* All models show improvement as the model number increases, suggesting iterative improvements in the model design or training.
### Interpretation
The chart illustrates the performance comparison of four different models across ten iterations. DocVQA and AI2D appear to be the most performant, with ChartQA closely following. MMMU, while showing consistent improvement, lags behind the other models in terms of overall score. The increasing trend in all models suggests that the iterative development process is effective in improving model performance. The data suggests that DocVQA and AI2D are the most mature models, while MMMU has the most potential for improvement. The relatively stable performance of DocVQA and AI2D could indicate that they are approaching their performance ceiling, while the consistent improvement of MMMU suggests that it is still in a phase of rapid development.