## Line Chart: Model Performance Scores Across Different Benchmarks
### Overview
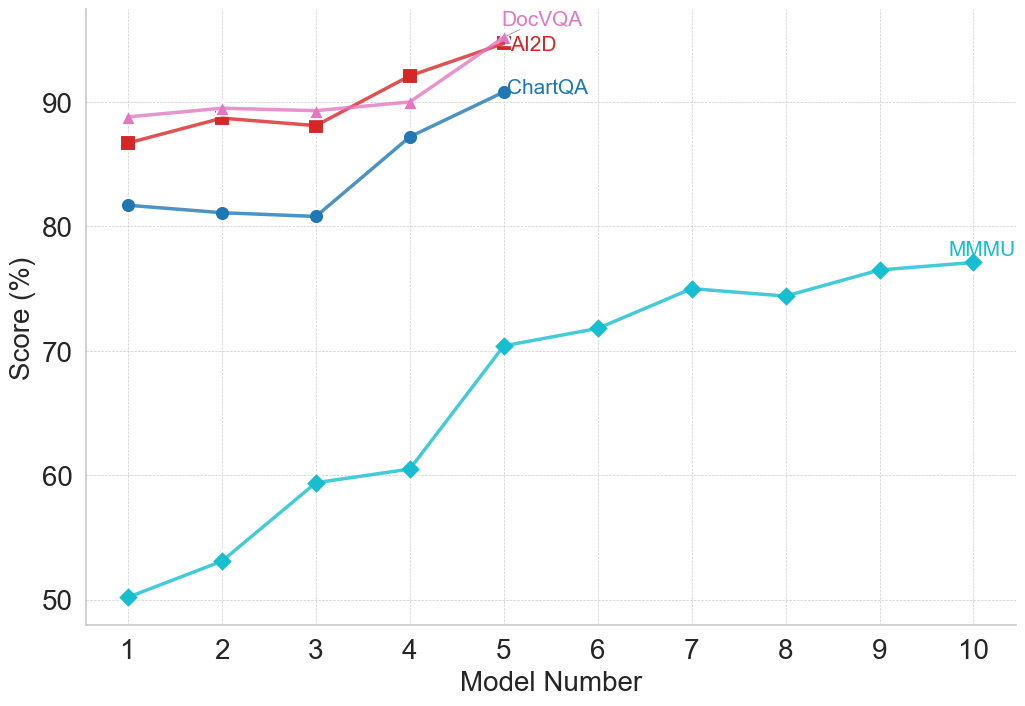
This image is a line chart displaying the performance scores of various models across four different evaluation benchmarks (DocVQA, AI2D, ChartQA, and MMMU). The chart tracks the progression of scores as the "Model Number" increases. A distinct visual feature is that three of the benchmarks only have data up to Model 5, while one benchmark continues up to Model 10.
### Components/Axes
**1. Y-Axis (Vertical):**
* **Label:** "Score (%)" (Positioned center-left, rotated 90 degrees counter-clockwise).
* **Scale:** Ranges from 50 to slightly above 90.
* **Markers:** Explicitly marked at 50, 60, 70, 80, and 90.
* **Gridlines:** Light grey, dashed horizontal lines extend from each 10-unit marker across the chart area.
**2. X-Axis (Horizontal):**
* **Label:** "Model Number" (Positioned bottom-center).
* **Scale:** Ranges from 1 to 10.
* **Markers:** Explicitly marked at integers 1, 2, 3, 4, 5, 6, 7, 8, 9, and 10.
* **Gridlines:** Light grey, dashed vertical lines extend upward from each integer marker.
**3. Legend / Data Series Labels:**
There is no separate legend box. Instead, the labels are placed directly adjacent to the final data point of each respective line.
* **DocVQA:** Pink text, positioned top-center, just above the end of the pink line.
* **AI2D:** Dark red text, positioned top-center, just to the right of the end of the red line.
* **ChartQA:** Dark blue text, positioned top-center, just to the right of the end of the dark blue line.
* **MMMU:** Light blue/teal text, positioned mid-right, just above the end of the light blue line.
---
### Detailed Analysis
*Note: All numerical values extracted below are approximate based on visual interpolation between the gridlines.*
**Data Series 1: DocVQA (Pink line, triangle markers)**
* **Trend Verification:** The line starts at a high baseline, remains relatively flat with a very slight dip between models 2 and 3, and then slopes upward sharply between models 4 and 5. The series terminates at Model 5.
* **Data Points:**
* Model 1: ~88.5%
* Model 2: ~89.5%
* Model 3: ~89.2%
* Model 4: ~90.0%
* Model 5: ~95.0% (Highest overall point on the chart)
**Data Series 2: AI2D (Red line, square markers)**
* **Trend Verification:** The line starts slightly below DocVQA, rises slightly, dips slightly at model 3, and then exhibits a steep, continuous upward slope through models 4 and 5. The series terminates at Model 5.
* **Data Points:**
* Model 1: ~86.5%
* Model 2: ~88.5%
* Model 3: ~88.0%
* Model 4: ~92.0%
* Model 5: ~94.8%
**Data Series 3: ChartQA (Dark Blue line, circle markers)**
* **Trend Verification:** The line starts lower than DocVQA and AI2D. It remains almost perfectly flat (with a microscopic downward drift) for the first three models, then slopes upward significantly between models 3 and 4, and continues upward to model 5. The series terminates at Model 5.
* **Data Points:**
* Model 1: ~81.5%
* Model 2: ~81.0%
* Model 3: ~80.8%
* Model 4: ~87.0%
* Model 5: ~90.8%
**Data Series 4: MMMU (Light Blue/Teal line, diamond markers)**
* **Trend Verification:** This line starts at the lowest point on the chart. It shows a consistent upward trajectory. There is a moderate rise to model 3, a flattening to model 4, a massive spike between models 4 and 5, and then a steady, shallower climb with a minor dip at model 8, ending at model 10. This is the only series that continues past Model 5.
* **Data Points:**
* Model 1: ~50.2%
* Model 2: ~53.0%
* Model 3: ~59.5%
* Model 4: ~60.5%
* Model 5: ~70.5%
* Model 6: ~71.8%
* Model 7: ~75.0%
* Model 8: ~74.5%
* Model 9: ~76.5%
* Model 10: ~77.0%
---
### Key Observations
1. **Grouping by Performance:** There is a distinct stratification in the data. DocVQA, AI2D, and ChartQA form a high-performing cluster (ranging roughly from 80% to 95%). MMMU forms a lower-performing tier (ranging from 50% to 77%).
2. **The "Model 5" Anomaly:** Three of the four data series (DocVQA, AI2D, ChartQA) abruptly stop at Model 5. Only MMMU continues to be tracked up to Model 10.
3. **Universal Improvement:** Regardless of the starting baseline, all four benchmarks show significant improvement by Model 5. The jump between Model 4 and Model 5 is particularly steep for all four metrics.
4. **Convergence at the Top:** By Model 5, DocVQA and AI2D have nearly converged at approximately 95%.
---
### Interpretation
* **Model Evolution:** The x-axis ("Model Number") likely represents sequential iterations or scaling sizes of a specific AI model family (e.g., Model 1 is the oldest/smallest, Model 10 is the newest/largest). The universal upward trend indicates that successive models are becoming more capable.
* **Benchmark Difficulty:** The data strongly suggests that MMMU is a significantly more difficult benchmark than DocVQA, AI2D, and ChartQA. While the model achieves near-saturation (95%) on DocVQA and AI2D by iteration 5, it only achieves ~70% on MMMU at the same stage.
* **Investigative Deduction (The Missing Data):** Why do three lines stop at Model 5? There are a few logical deductions:
1. *Saturation:* DocVQA and AI2D hit ~95% at Model 5. The researchers may have stopped testing these benchmarks because the model effectively "solved" them, making further testing redundant or uninformative.
2. *Cost/Resource Allocation:* Evaluating models can be expensive. If MMMU is the primary benchmark of interest (perhaps because it is the most challenging and leaves the most room for measurable improvement), researchers may have chosen to only run the MMMU benchmark for models 6 through 10 to save compute resources.
3. *Change in Focus:* The chart might be illustrating a narrative where earlier models were tested broadly, but later development (Models 6-10) was specifically optimized for or solely evaluated against the MMMU standard.
* **The "Breakthrough" Point:** Something significant happened in the model architecture or training data between Model 4 and Model 5. Every single benchmark shows a sharp, anomalous spike in performance at this exact interval, suggesting a major leap in capability rather than a gradual iterative improvement.