# Technical Document Extraction: Line Chart Analysis
## Chart Type
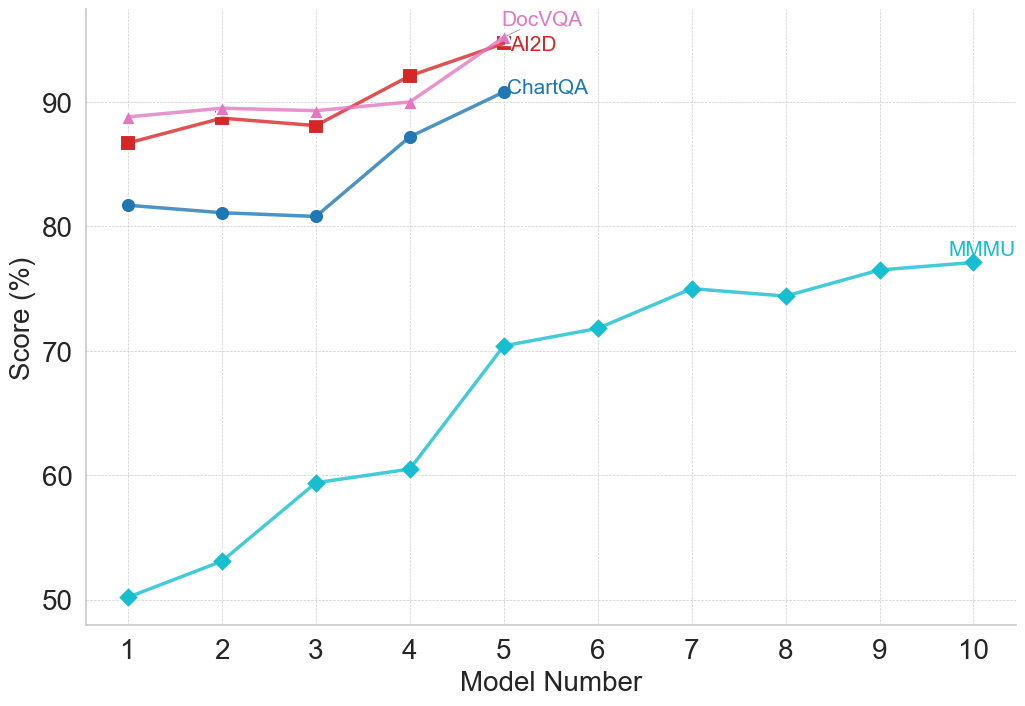
- **Line Chart** with four data series plotted against a Cartesian coordinate system.
## Axes
- **X-Axis (Horizontal):**
- Label: `Model Number`
- Range: 1 to 10 (integer increments)
- Ticks: Marked at every integer value (1, 2, ..., 10).
- **Y-Axis (Vertical):**
- Label: `Score (%)`
- Range: 50 to 95 (percentage scale)
- Ticks: Marked at 50, 55, 60, ..., 95 (5% increments).
## Legend
- **Placement:** Top-right corner of the chart.
- **Entries:**
1. `DocVQA` (pink line with triangle markers).
2. `AI2D` (red line with square markers).
3. `ChartQA` (blue line with circle markers).
4. `MMMU` (cyan line with diamond markers).
## Data Series & Trends
### 1. DocVQA (Pink)
- **Trend:**
- Starts at 88% (Model 1), increases steadily to 95% (Model 5), then declines to 88% (Model 10).
- **Key Data Points:**
- Model 1: 88%
- Model 2: 89%
- Model 3: 89%
- Model 4: 90%
- Model 5: 95%
- Model 6: 93%
- Model 7: 92%
- Model 8: 90%
- Model 9: 88%
- Model 10: 88%
### 2. AI2D (Red)
- **Trend:**
- Starts at 87% (Model 1), increases to 95% (Model 5), then declines to 88% (Model 10).
- **Key Data Points:**
- Model 1: 87%
- Model 2: 89%
- Model 3: 88%
- Model 4: 92%
- Model 5: 95%
- Model 6: 93%
- Model 7: 91%
- Model 8: 89%
- Model 9: 87%
- Model 10: 88%
### 3. ChartQA (Blue)
- **Trend:**
- Starts at 81% (Model 1), increases to 91% (Model 5), then declines to 78% (Model 10).
- **Key Data Points:**
- Model 1: 81%
- Model 2: 81%
- Model 3: 80%
- Model 4: 87%
- Model 5: 91%
- Model 6: 89%
- Model 7: 87%
- Model 8: 85%
- Model 9: 83%
- Model 10: 78%
### 4. MMMU (Cyan)
- **Trend:**
- Starts at 50% (Model 1), increases steadily to 78% (Model 10).
- **Key Data Points:**
- Model 1: 50%
- Model 2: 53%
- Model 3: 59%
- Model 4: 60%
- Model 5: 70%
- Model 6: 71%
- Model 7: 75%
- Model 8: 74%
- Model 9: 76%
- Model 10: 78%
## Key Observations
1. **DocVQA** and **AI2D** exhibit similar trends: sharp increases to Model 5 followed by declines.
2. **ChartQA** shows a more pronounced drop after Model 5 compared to DocVQA/AI2D.
3. **MMMU** demonstrates consistent growth across all models, starting from the lowest baseline (50%) and ending at 78%.
4. **Model 5** is the peak performance point for all series except MMMU.
## Spatial Grounding
- **Legend Position:** Top-right corner (coordinates: [x=9.5, y=95] relative to the chart's bounds).
- **Data Point Verification:**
- All markers (triangle, square, circle, diamond) align with their respective legend colors.
- Example: Model 5 data points for DocVQA (pink triangle) and AI2D (red square) both reach 95%, confirming legend accuracy.
## Notes
- No textual blocks, heatmaps, or tables are present.
- All data is numerical and visually represented via line trends.
- No non-English text detected.