## Diagram: Total Value Calculation
### Overview
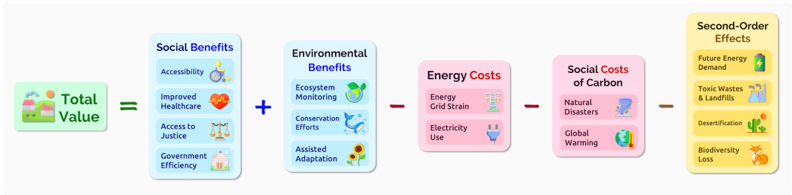
The image presents a diagram illustrating the calculation of "Total Value" by summing "Social Benefits" and "Environmental Benefits," then subtracting "Energy Costs" and "Social Costs of Carbon," to arrive at "Second-Order Effects."
### Components/Axes
* **Total Value:** Represented by a green rounded rectangle containing an image of houses and trees.
* **Social Benefits:** A blue rounded rectangle listing:
* Accessibility (wheelchair icon)
* Improved Healthcare (heart icon)
* Access to Justice (scales icon)
* Government Efficiency (house icon)
* **Environmental Benefits:** A blue rounded rectangle listing:
* Ecosystem Monitoring (globe icon)
* Conservation Efforts (whale icon)
* Assisted Adaptation (sunflower icon)
* **Energy Costs:** A pink rounded rectangle listing:
* Energy Grid Strain (electrical tower icon)
* Electricity Use (plug icon)
* **Social Costs of Carbon:** A pink rounded rectangle listing:
* Natural Disasters (tornado icon)
* Global Warming (globe icon)
* **Second-Order Effects:** A yellow rounded rectangle listing:
* Future Energy Demand (battery icon)
* Toxic Wastes & Landfills (smokestacks icon)
* Desertification (cactus icon)
* Biodiversity Loss (fox icon)
* **Mathematical Operators:** Plus signs (+) and minus signs (-) connect the components, indicating addition and subtraction.
### Detailed Analysis
The diagram shows a sequential calculation:
1. **Total Value** is the starting point.
2. **Social Benefits** and **Environmental Benefits** are added to the Total Value.
3. **Energy Costs** and **Social Costs of Carbon** are subtracted from the sum of the previous components.
4. The result of these operations leads to **Second-Order Effects**.
### Key Observations
* The diagram uses a simple equation-like structure to represent the calculation of Total Value.
* Each component (Benefits, Costs, Effects) is further broken down into specific sub-categories.
* Icons are used to visually represent each sub-category, aiding in quick comprehension.
### Interpretation
The diagram illustrates a holistic approach to calculating Total Value, considering not only direct benefits but also the costs and subsequent effects. It suggests that a true assessment of value must account for social and environmental factors, as well as the energy implications and social costs associated with carbon emissions. The "Second-Order Effects" highlight the long-term consequences of these calculations, emphasizing the importance of sustainable practices. The diagram implies that maximizing Total Value requires balancing benefits with minimizing costs and negative effects.