\n
## Diagram: Total Value Calculation
### Overview
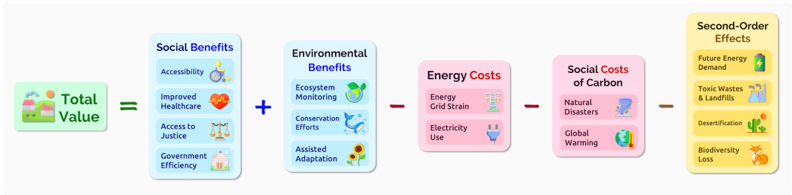
The image presents a diagram illustrating the calculation of "Total Value". It depicts an equation where Total Value is determined by adding "Social Benefits" and "Environmental Benefits", then subtracting "Energy Costs" and "Social Costs of Carbon", and finally subtracting "Second-Order Effects". Each of these components is further broken down into specific sub-categories represented by icons. The diagram is arranged horizontally, flowing from left to right.
### Components/Axes
The diagram consists of five main blocks:
1. **Total Value:** Represented by a green box with an icon depicting various elements.
2. **Social Benefits:** A blue box containing four sub-categories.
3. **Environmental Benefits:** A light blue box containing four sub-categories.
4. **Energy Costs:** A pink box containing two sub-categories.
5. **Social Costs of Carbon:** A pink box containing three sub-categories.
6. **Second-Order Effects:** An orange box containing four sub-categories.
The equation structure is: Total Value = Social Benefits + Environmental Benefits - Energy Costs - Social Costs of Carbon - Second-Order Effects.
### Content Details
Here's a breakdown of the sub-categories within each block:
* **Total Value:** (Icon: A collection of buildings, trees, and a person) - No specific data points, just a label.
* **Social Benefits:**
* Accessibility (Icon: A person in a wheelchair)
* Improved Healthcare (Icon: A heart)
* Access to Justice (Icon: Scales of justice)
* Government Efficiency (Icon: A building)
* **Environmental Benefits:**
* Ecosystem Monitoring (Icon: A leaf)
* Conservation Efforts (Icon: A whale)
* Assisted Adaptation (Icon: A sunflower)
* **Energy Costs:**
* Energy Grid Strain (Icon: Electrical towers)
* Electricity Use (Icon: A lightbulb)
* **Social Costs of Carbon:**
* Natural Disasters (Icon: A flood/storm)
* Global Warming (Icon: The Earth with rising temperatures)
* Desertification (Icon: A dry, cracked landscape)
* **Second-Order Effects:**
* Future Energy Demand (Icon: A fuel gauge)
* Toxic Wastes and Landfills (Icon: A hazardous waste symbol)
* Desertification (Icon: A dry, cracked landscape)
* Biodiversity Loss (Icon: A fox)
### Key Observations
The diagram presents a qualitative model for calculating "Total Value". It doesn't provide any quantitative data or numerical values. The diagram emphasizes a holistic approach, considering both positive (Social & Environmental Benefits) and negative (Energy Costs, Social Costs of Carbon, Second-Order Effects) factors. The inclusion of "Second-Order Effects" suggests an attempt to account for indirect or long-term consequences. The repetition of "Desertification" in both "Social Costs of Carbon" and "Second-Order Effects" could indicate its significant impact.
### Interpretation
This diagram illustrates a framework for evaluating the overall value of a project, policy, or technology. It moves beyond traditional cost-benefit analysis by incorporating social and environmental considerations, as well as potential long-term consequences. The model suggests that "Total Value" is not simply a matter of economic gain but also encompasses societal well-being and ecological sustainability. The diagram is a conceptual tool for prompting discussion and identifying relevant factors, rather than a precise calculation method. The lack of numerical values implies that the relative importance of each factor is subject to interpretation and context. The diagram is a high-level overview and would require further definition of each component to be practically applied. It is a qualitative model, not a quantitative one.