## Line Chart: RMSE vs. n for Different Algorithms
### Overview
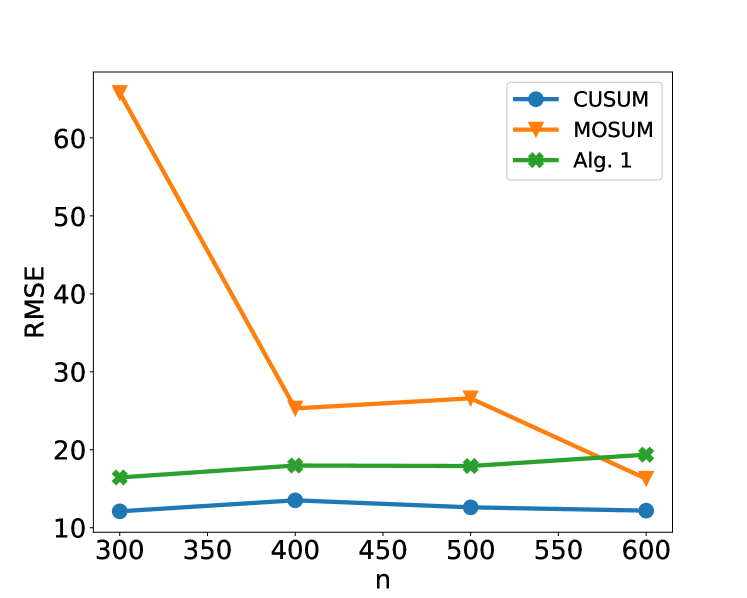
This image displays a line chart comparing the Root Mean Square Error (RMSE) for three different algorithms (CUSUM, MOSUM, and Alg. 1) across a range of 'n' values. The x-axis represents 'n', and the y-axis represents RMSE.
### Components/Axes
* **Chart Type**: Line Chart
* **Title**: Implicitly, the chart compares RMSE performance of algorithms against 'n'.
* **X-axis Label**: 'n'
* **X-axis Markers**: 300, 350, 400, 450, 500, 550, 600
* **Y-axis Label**: 'RMSE'
* **Y-axis Markers**: 10, 20, 30, 40, 50, 60
* **Legend**: Located in the top-right quadrant of the chart.
* **CUSUM**: Represented by a blue line with circular markers (•).
* **MOSUM**: Represented by an orange line with triangular markers (▲).
* **Alg. 1**: Represented by a green line with cross markers (x).
### Detailed Analysis
**Data Series: CUSUM (Blue line with •)**
* **Trend**: The CUSUM line generally slopes slightly downward, indicating a decrease in RMSE as 'n' increases, with minor fluctuations.
* **Data Points (approximate values)**:
* At n=300: RMSE ≈ 12.5
* At n=400: RMSE ≈ 13.5
* At n=500: RMSE ≈ 12.5
* At n=600: RMSE ≈ 12.5
**Data Series: MOSUM (Orange line with ▲)**
* **Trend**: The MOSUM line shows a sharp initial decrease in RMSE from n=300 to n=400, followed by a slight increase from n=400 to n=500, and then a significant decrease from n=500 to n=600.
* **Data Points (approximate values)**:
* At n=300: RMSE ≈ 65
* At n=400: RMSE ≈ 25
* At n=500: RMSE ≈ 27
* At n=600: RMSE ≈ 18
**Data Series: Alg. 1 (Green line with x)**
* **Trend**: The Alg. 1 line shows a slight upward trend in RMSE from n=300 to n=500, and then a slight decrease from n=500 to n=600.
* **Data Points (approximate values)**:
* At n=300: RMSE ≈ 16.5
* At n=400: RMSE ≈ 18
* At n=500: RMSE ≈ 18.5
* At n=600: RMSE ≈ 19
### Key Observations
* The MOSUM algorithm exhibits the highest RMSE at n=300, but shows a dramatic improvement by n=400.
* The CUSUM algorithm consistently maintains the lowest RMSE across all observed values of 'n'.
* Alg. 1 shows a relatively stable but slightly increasing RMSE as 'n' increases, before a minor dip at n=600.
* The MOSUM algorithm's performance is the most variable, with a large drop and then a rise and another drop.
### Interpretation
The chart demonstrates the performance of three algorithms (CUSUM, MOSUM, and Alg. 1) in terms of Root Mean Square Error (RMSE) as a function of a parameter 'n'. RMSE is a common metric for evaluating the accuracy of a model or algorithm; lower RMSE values indicate better performance (i.e., less error).
* **CUSUM** appears to be the most robust and consistently performs best, maintaining a low RMSE across the tested range of 'n'. This suggests it is a reliable choice for this particular problem.
* **MOSUM** shows a very interesting and potentially problematic behavior. Its extremely high RMSE at n=300 suggests it is highly sensitive to initial conditions or small sample sizes. The sharp drop to n=400 indicates a significant improvement, but the subsequent rise and fall suggest instability or a complex relationship with 'n' that warrants further investigation. The large initial error might be an outlier or indicative of a specific failure mode for small 'n'.
* **Alg. 1** shows a steady, albeit slight, increase in error as 'n' grows, before a minor improvement at the largest 'n'. This suggests that for larger datasets, its performance might degrade slightly, or it reaches a plateau.
In summary, CUSUM is the most stable and accurate algorithm shown. MOSUM is highly variable and performs poorly at small 'n', but can achieve moderate performance at larger 'n'. Alg. 1 is moderately accurate and shows a slight tendency towards increased error with larger 'n'. The choice of algorithm would depend on the specific requirements for accuracy, stability, and the expected range of 'n'. The behavior of MOSUM, in particular, suggests it might be suitable only for specific ranges of 'n' or might require careful tuning.