\n
## Line Chart: RMSE vs. n for Change Detection Algorithms
### Overview
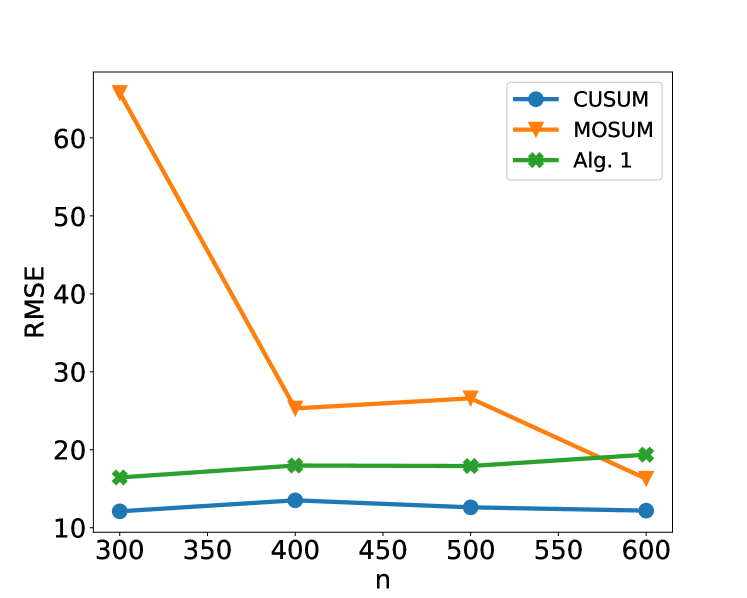
The image presents a line chart comparing the Root Mean Squared Error (RMSE) performance of three change detection algorithms – CUSUM, MOSUM, and Alg. 1 – as a function of the sample size 'n'. The chart visually demonstrates how the RMSE changes for each algorithm as 'n' increases from 300 to 600.
### Components/Axes
* **X-axis:** Labeled "n", representing the sample size. The scale ranges from approximately 300 to 600, with markers at 300, 350, 400, 450, 500, 550, and 600.
* **Y-axis:** Labeled "RMSE", representing the Root Mean Squared Error. The scale ranges from approximately 10 to 65, with markers at 10, 20, 30, 40, 50, and 60.
* **Legend:** Located in the top-right corner of the chart. It identifies the three data series:
* CUSUM (Blue line with circle markers)
* MOSUM (Orange line with square markers)
* Alg. 1 (Green line with triangle markers)
### Detailed Analysis
* **CUSUM (Blue):** The line representing CUSUM is relatively flat. It starts at approximately RMSE = 12 at n = 300. It decreases slightly to approximately RMSE = 11 at n = 500, and then increases slightly to approximately RMSE = 12 at n = 600.
* **MOSUM (Orange):** The MOSUM line exhibits a strong downward trend. It begins at approximately RMSE = 68 at n = 300. It decreases sharply to approximately RMSE = 27 at n = 400. The decline continues, reaching approximately RMSE = 24 at n = 500, and finally approximately RMSE = 21 at n = 600.
* **Alg. 1 (Green):** The Alg. 1 line shows a moderate upward trend. It starts at approximately RMSE = 17 at n = 300. It increases to approximately RMSE = 19 at n = 400 and remains relatively stable around RMSE = 19-20 until n = 500. It then decreases slightly to approximately RMSE = 18 at n = 600.
### Key Observations
* MOSUM demonstrates the most significant improvement in RMSE as 'n' increases, indicating it benefits substantially from larger sample sizes.
* CUSUM's RMSE remains relatively constant across all sample sizes, suggesting its performance is less sensitive to 'n'.
* Alg. 1 shows a slight initial increase in RMSE, followed by stabilization and a minor decrease.
* At n=300, MOSUM has a significantly higher RMSE than CUSUM and Alg. 1.
* At n=600, the RMSE values for all three algorithms are relatively close, but MOSUM still has the lowest RMSE.
### Interpretation
The chart suggests that MOSUM is the most effective algorithm for change detection when a sufficiently large sample size is available. While it starts with a high RMSE, its performance improves dramatically with increasing 'n'. CUSUM provides a stable, but less optimal, performance regardless of sample size. Alg. 1's performance is intermediate, showing some sensitivity to 'n' but not as pronounced as MOSUM.
The data implies that the choice of algorithm should be guided by the expected sample size. If 'n' is small, CUSUM or Alg. 1 might be preferable. However, if 'n' is large, MOSUM is likely to yield the most accurate results. The initial high RMSE of MOSUM at small 'n' could be due to its reliance on statistical properties that require a sufficient number of observations to be accurately estimated. The relatively flat performance of CUSUM suggests it may be more robust to small sample sizes or less reliant on precise statistical estimation.