\n
## Line Chart: Performance Comparison of Change-Point Detection Algorithms
### Overview
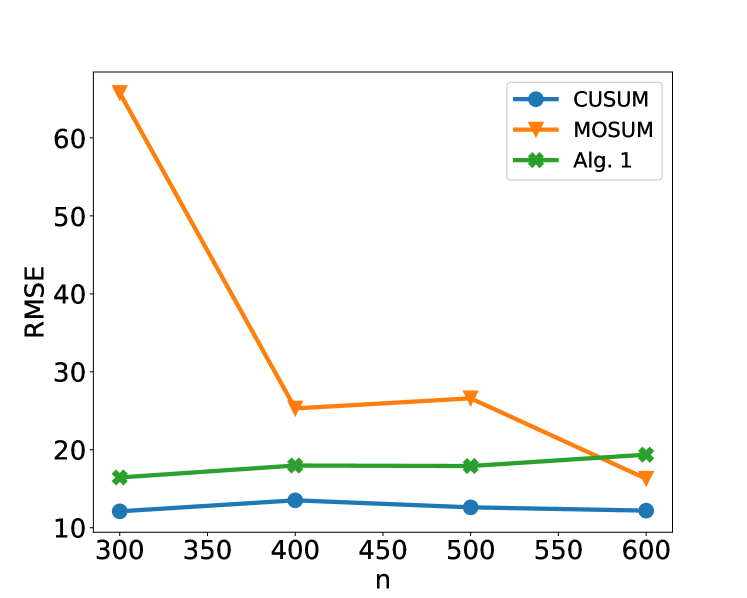
The image is a line chart comparing the Root Mean Square Error (RMSE) performance of three different algorithms (CUSUM, MOSUM, and Alg. 1) as a function of sample size, denoted by `n`. The chart demonstrates how the error metric for each algorithm changes as the amount of data increases.
### Components/Axes
* **X-Axis:** Labeled "n". It represents the sample size or number of data points. The axis has major tick marks and labels at the values: 300, 350, 400, 450, 500, 550, and 600.
* **Y-Axis:** Labeled "RMSE". It represents the Root Mean Square Error, a standard measure of prediction or estimation error. The axis has major tick marks and labels at intervals of 10, ranging from 10 to 60.
* **Legend:** Positioned in the top-right corner of the chart area. It contains three entries:
* **CUSUM:** Represented by a blue line with circular markers.
* **MOSUM:** Represented by an orange line with downward-pointing triangle markers.
* **Alg. 1:** Represented by a green line with star (asterisk) markers.
### Detailed Analysis
The chart plots three distinct data series. Below is an analysis of each, including approximate data points extracted from the visual positions of the markers.
**1. CUSUM (Blue line, circle markers)**
* **Trend:** The line is relatively flat and stable, showing only minor fluctuations across the range of `n`. It exhibits a very slight downward trend from n=400 to n=600.
* **Approximate Data Points:**
* n = 300: RMSE ≈ 12
* n = 400: RMSE ≈ 13.5
* n = 500: RMSE ≈ 12.5
* n = 600: RMSE ≈ 12
**2. MOSUM (Orange line, triangle markers)**
* **Trend:** This series shows the most dramatic change. It starts with a very high RMSE at the smallest sample size (n=300), drops sharply by n=400, rises slightly at n=500, and then decreases again by n=600. The overall trend is a significant reduction in error as `n` increases.
* **Approximate Data Points:**
* n = 300: RMSE ≈ 66 (This is the highest value on the chart)
* n = 400: RMSE ≈ 25.5
* n = 500: RMSE ≈ 27
* n = 600: RMSE ≈ 16.5
**3. Alg. 1 (Green line, star markers)**
* **Trend:** This line shows a gentle, consistent upward trend. The RMSE increases slowly but steadily as the sample size `n` grows.
* **Approximate Data Points:**
* n = 300: RMSE ≈ 16.5
* n = 400: RMSE ≈ 18
* n = 500: RMSE ≈ 18
* n = 600: RMSE ≈ 19.5
### Key Observations
1. **Performance Hierarchy at Small n (300):** There is a vast difference in performance. MOSUM has a very high error (~66), while CUSUM (~12) and Alg. 1 (~16.5) are much lower and closer to each other.
2. **Convergence at Large n (600):** The performance gap narrows significantly. At n=600, the RMSE values are: CUSUM (~12), MOSUM (~16.5), and Alg. 1 (~19.5). MOSUM's error has decreased to a level comparable to the others.
3. **Intersection Point:** The lines for MOSUM and Alg. 1 intersect between n=550 and n=600. At n=600, MOSUM's RMSE (~16.5) is lower than Alg. 1's (~19.5), indicating it has become the better-performing algorithm of the two for this sample size.
4. **Stability vs. Improvement:** CUSUM is the most stable algorithm, with minimal sensitivity to sample size in this range. MOSUM shows the greatest capacity for improvement with more data. Alg. 1 shows a slight degradation in performance (increasing error) with more data.
### Interpretation
This chart likely illustrates a benchmark study for change-point detection algorithms. The data suggests:
* **Algorithm Suitability Depends on Data Volume:** MOSUM appears ill-suited for small datasets (n=300) but becomes competitive and even superior to Alg. 1 as the dataset grows to n=600. Its high initial error might be due to a longer initialization period or a requirement for more data to estimate parameters reliably.
* **Robustness of CUSUM:** The CUSUM algorithm demonstrates robust and consistent performance across the tested range of sample sizes. It is the best performer (lowest RMSE) at n=300, n=500, and n=600, making it a reliable choice if sample size is variable or unknown.
* **Potential Scaling Issue for Alg. 1:** The gentle upward trend for Alg. 1 is noteworthy. It suggests that, within this range, its error does not decrease with more data and may even increase slightly. This could indicate a bias in the algorithm or that its assumptions become less valid as `n` grows, which would be a critical finding for its application on large datasets.
* **The "Peircean" Reading:** The chart tells a story of trade-offs. There is no single "best" algorithm. The choice depends on the expected data regime. For scarce data, CUSUM is optimal. For abundant data (n≥600), MOSUM may be preferable to Alg. 1, and CUSUM remains a strong, stable contender. The investigation would next ask *why* MOSUM improves and Alg. 1 degrades—likely pointing to differences in their underlying statistical models or estimation procedures.