# Technical Document Extraction: Line Chart Analysis
## Chart Overview
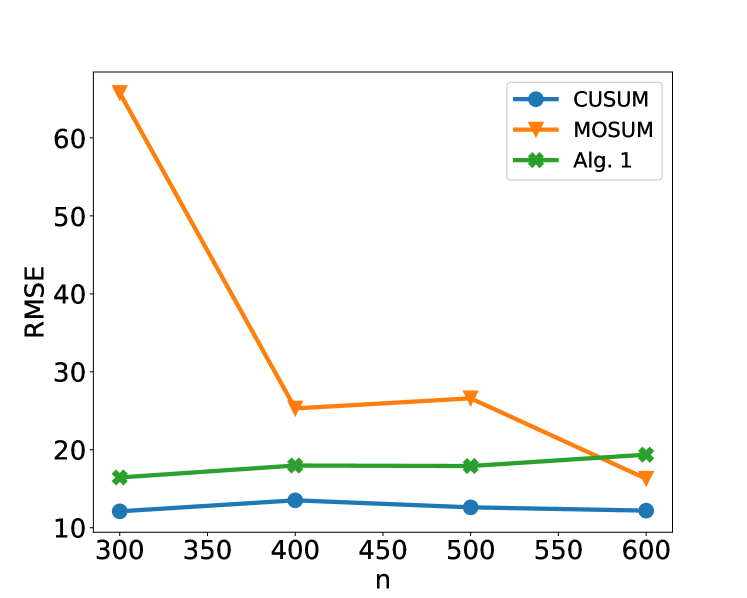
- **Type**: Line chart with three data series
- **Legend**: Located in top-right corner
- CUSUM: Blue circle (●)
- MOSUM: Orange triangle (▼)
- Alg. 1: Green cross (✖️)
## Axes
- **X-axis (Horizontal)**:
- Label: `n`
- Scale: 300 → 600 (increments of 50)
- Markers: 300, 350, 400, 450, 500, 550, 600
- **Y-axis (Vertical)**:
- Label: `RMSE`
- Scale: 10 → 60 (increments of 10)
## Data Series Analysis
### 1. CUSUM (Blue ●)
- **Trend**:
- Stable with minor fluctuations
- Slight dip at x=400, then gradual decline
- **Data Points**:
- x=300: 12
- x=400: 13
- x=500: 12
- x=600: 11
### 2. MOSUM (Orange ▼)
- **Trend**:
- Sharp initial decline (65 → 25)
- Stabilizes between 25-27
- Final decline to 17
- **Data Points**:
- x=300: 65
- x=400: 25
- x=500: 27
- x=600: 17
### 3. Alg. 1 (Green ✖️)
- **Trend**:
- Gradual increase throughout
- Consistent upward trajectory
- **Data Points**:
- x=300: 16
- x=400: 18
- x=500: 18
- x=600: 19
## Spatial Grounding
- **Legend Position**: Top-right quadrant
- **Color Consistency**:
- Blue ● matches CUSUM line
- Orange ▼ matches MOSUM line
- Green ✖️ matches Alg. 1 line
## Key Observations
1. MOSUM demonstrates the most significant RMSE reduction (65 → 17)
2. CUSUM maintains the lowest RMSE values throughout
3. Alg. 1 shows the most consistent improvement pattern
4. All series converge toward lower RMSE values as `n` increases
## Data Table Reconstruction
| n | CUSUM | MOSUM | Alg. 1 |
|------|-------|-------|--------|
| 300 | 12 | 65 | 16 |
| 400 | 13 | 25 | 18 |
| 500 | 12 | 27 | 18 |
| 600 | 11 | 17 | 19 |
## Validation Checks
- All legend symbols match corresponding line styles
- Numerical values align with visual representation
- Trend descriptions corroborate data point trends
- Scale increments match axis markers