## Bar Charts: Token Consumption and Convergence Speed by Method
### Overview
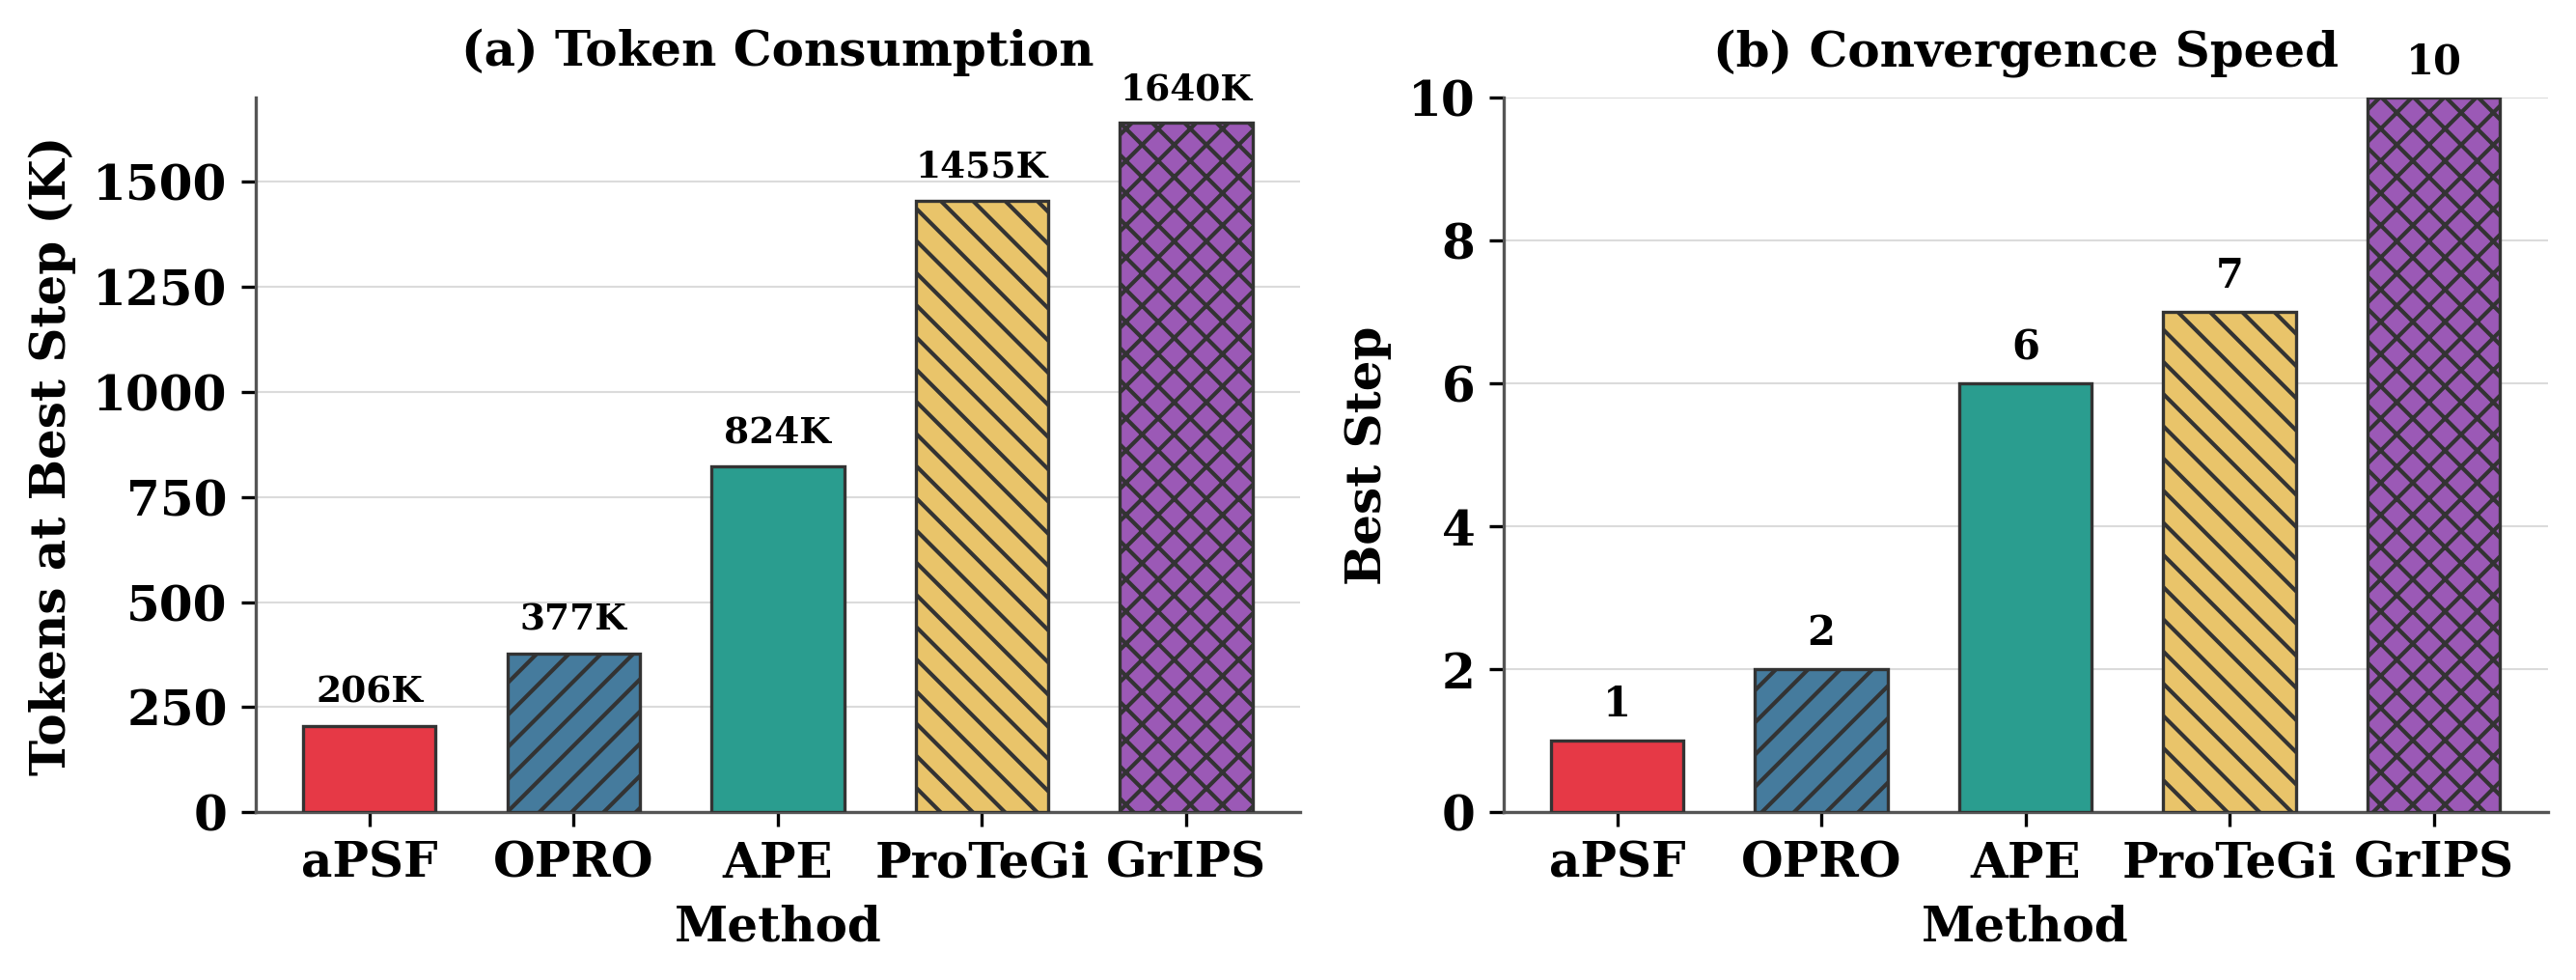
The image contains two side-by-side bar charts comparing five computational methods (aPSF, OPRO, APE, ProTeGi, GrIPS) across two metrics: **Token Consumption** (measured in thousands of tokens, K) and **Convergence Speed** (measured in "Best Step" units). Both charts use color-coded bars with distinct patterns for visual differentiation.
---
### Components/Axes
#### Chart (a): Token Consumption
- **X-axis**: Methods (aPSF, OPRO, APE, ProTeGi, GrIPS)
- **Y-axis**: Tokens at Best Step (K), scaled from 0 to 1500 in increments of 250
- **Legend**:
- Red (solid): aPSF
- Blue (diagonal stripes): OPRO
- Teal (solid): APE
- Yellow (diagonal stripes): ProTeGi
- Purple (crosshatch): GrIPS
#### Chart (b): Convergence Speed
- **X-axis**: Same methods as Chart (a)
- **Y-axis**: Best Step, scaled from 0 to 10 in increments of 2
- **Legend**: Same color patterns as Chart (a)
---
### Detailed Analysis
#### Chart (a): Token Consumption
- **aPSF**: 206K tokens (red bar, shortest)
- **OPRO**: 377K tokens (blue bar, second shortest)
- **APE**: 824K tokens (teal bar, mid-range)
- **ProTeGi**: 1455K tokens (yellow bar, second tallest)
- **GrIPS**: 1640K tokens (purple bar, tallest)
#### Chart (b): Convergence Speed
- **aPSF**: 1 step (red bar, shortest)
- **OPRO**: 2 steps (blue bar, second shortest)
- **APE**: 6 steps (teal bar, mid-range)
- **ProTeGi**: 7 steps (yellow bar, second tallest)
- **GrIPS**: 10 steps (purple bar, tallest)
---
### Key Observations
1. **Token Consumption Trends**:
- Token usage increases monotonically from aPSF (206K) to GrIPS (1640K).
- ProTeGi and GrIPS consume significantly more tokens than other methods.
2. **Convergence Speed Trends**:
- Convergence speed improves from aPSF (1 step) to GrIPS (10 steps).
- APE achieves moderate speed (6 steps) despite mid-range token use (824K).
3. **Correlation**:
- Higher token consumption generally aligns with better convergence speed (e.g., GrIPS: 1640K tokens → 10 steps; aPSF: 206K tokens → 1 step).
- Exceptions: APE (824K tokens → 6 steps) underperforms ProTeGi (1455K tokens → 7 steps) despite lower token use.
---
### Interpretation
The data suggests a trade-off between computational efficiency (token consumption) and performance (convergence speed). While GrIPS and ProTeGi dominate in both metrics, APE demonstrates a moderate balance, achieving reasonable speed (6 steps) with lower token use (824K) compared to ProTeGi. The stark contrast between aPSF/OPRO and the top-tier methods highlights the importance of method selection for resource-constrained vs. high-performance applications.
**Notable Outlier**: APE’s convergence speed (6 steps) is closer to ProTeGi/GrIPS than to OPRO/aPSF, despite its token use being closer to OPRO. This implies architectural efficiency in APE’s design.