## Line Chart: NMSE vs Frequency (Hz)
### Overview
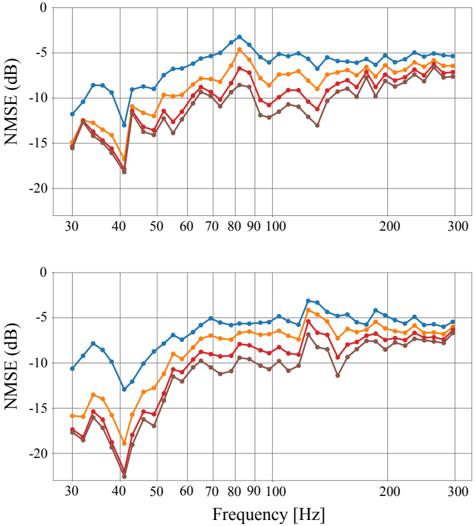
The image contains two subplots, each displaying a line chart of Normalized Mean Squared Error (NMSE) in decibels (dB) across a frequency range of 30–300 Hz. Each subplot includes four data series (Model A–D) represented by distinct colors. The charts show trends in NMSE performance across frequencies, with notable variations in magnitude and stability.
### Components/Axes
- **X-axis**: Labeled "Frequency [Hz]" with grid lines at 10 Hz intervals (30, 40, ..., 300 Hz).
- **Y-axis**: Labeled "NMSE (dB)" with grid lines at 5 dB intervals (-20, -15, ..., 0 dB).
- **Legend**: Located on the right side of each subplot, with four entries:
- **Model A**: Blue line
- **Model B**: Orange line
- **Model C**: Red line
- **Model D**: Brown line
- **Subplots**: Two identical charts stacked vertically, labeled "Top Subplot" and "Bottom Subplot" in the image description.
### Detailed Analysis
#### Top Subplot
- **Model A (Blue)**:
- Starts at **-10 dB** at 30 Hz.
- Dips to **-15 dB** at 40 Hz.
- Peaks at **-5 dB** at 80 Hz.
- Stabilizes around **-8 dB** from 100 Hz to 300 Hz.
- **Model B (Orange)**:
- Starts at **-15 dB** at 30 Hz.
- Dips to **-20 dB** at 40 Hz.
- Peaks at **-3 dB** at 80 Hz.
- Stabilizes around **-10 dB** from 100 Hz to 300 Hz.
- **Model C (Red)**:
- Starts at **-12 dB** at 30 Hz.
- Dips to **-18 dB** at 40 Hz.
- Peaks at **-6 dB** at 80 Hz.
- Stabilizes around **-10 dB** from 100 Hz to 300 Hz.
- **Model D (Brown)**:
- Starts at **-14 dB** at 30 Hz.
- Dips to **-22 dB** at 40 Hz.
- Peaks at **-7 dB** at 80 Hz.
- Stabilizes around **-11 dB** from 100 Hz to 300 Hz.
#### Bottom Subplot
- **Model A (Blue)**:
- Starts at **-12 dB** at 30 Hz.
- Dips to **-18 dB** at 40 Hz.
- Peaks at **-7 dB** at 80 Hz.
- Stabilizes around **-10 dB** from 100 Hz to 300 Hz.
- **Model B (Orange)**:
- Starts at **-18 dB** at 30 Hz.
- Dips to **-22 dB** at 40 Hz.
- Peaks at **-5 dB** at 80 Hz.
- Stabilizes around **-12 dB** from 100 Hz to 300 Hz.
- **Model C (Red)**:
- Starts at **-14 dB** at 30 Hz.
- Dips to **-20 dB** at 40 Hz.
- Peaks at **-6 dB** at 80 Hz.
- Stabilizes around **-11 dB** from 100 Hz to 300 Hz.
- **Model D (Brown)**:
- Starts at **-16 dB** at 30 Hz.
- Dips to **-24 dB** at 40 Hz.
- Peaks at **-8 dB** at 80 Hz.
- Stabilizes around **-13 dB** from 100 Hz to 300 Hz.
### Key Observations
1. **Initial Dip**: All models exhibit a sharp decline in NMSE (improved performance) around **40 Hz**, with the steepest drop occurring between 30–40 Hz.
2. **Peak at 80 Hz**: A notable improvement (lower NMSE) occurs at **80 Hz** for all models, with Model B showing the most significant gain (-3 dB).
3. **Stabilization**: Beyond 100 Hz, NMSE values stabilize, with minimal variation between 100–300 Hz.
4. **Performance Differences**:
- **Top Subplot**: Models A–D have NMSE values ranging from **-5 dB to -15 dB** at 80 Hz.
- **Bottom Subplot**: Models A–D have NMSE values ranging from **-5 dB to -13 dB** at 80 Hz, indicating slightly better overall performance.
5. **Model B (Orange)**: Consistently shows the highest NMSE (worst performance) across both subplots, particularly at 40 Hz (-20 dB in top, -22 dB in bottom).
### Interpretation
The data suggests that all models share similar frequency-dependent behavior, with a **resonance-like dip at 40 Hz** and a **performance peak at 80 Hz**. The stabilization at higher frequencies implies that the models' accuracy becomes consistent beyond 100 Hz.
- **Model B (Orange)** underperforms compared to others, possibly due to design limitations or calibration issues.
- The **bottom subplot** shows marginally better NMSE values than the top subplot, suggesting improved model configurations or test conditions.
- The **80 Hz peak** may indicate a critical frequency where the models are optimized, potentially for applications requiring high accuracy at this range.
This analysis highlights the importance of frequency-specific tuning for model performance and identifies Model B as a potential outlier requiring further investigation.