## Bar Chart: Model Accuracy Comparison
### Overview
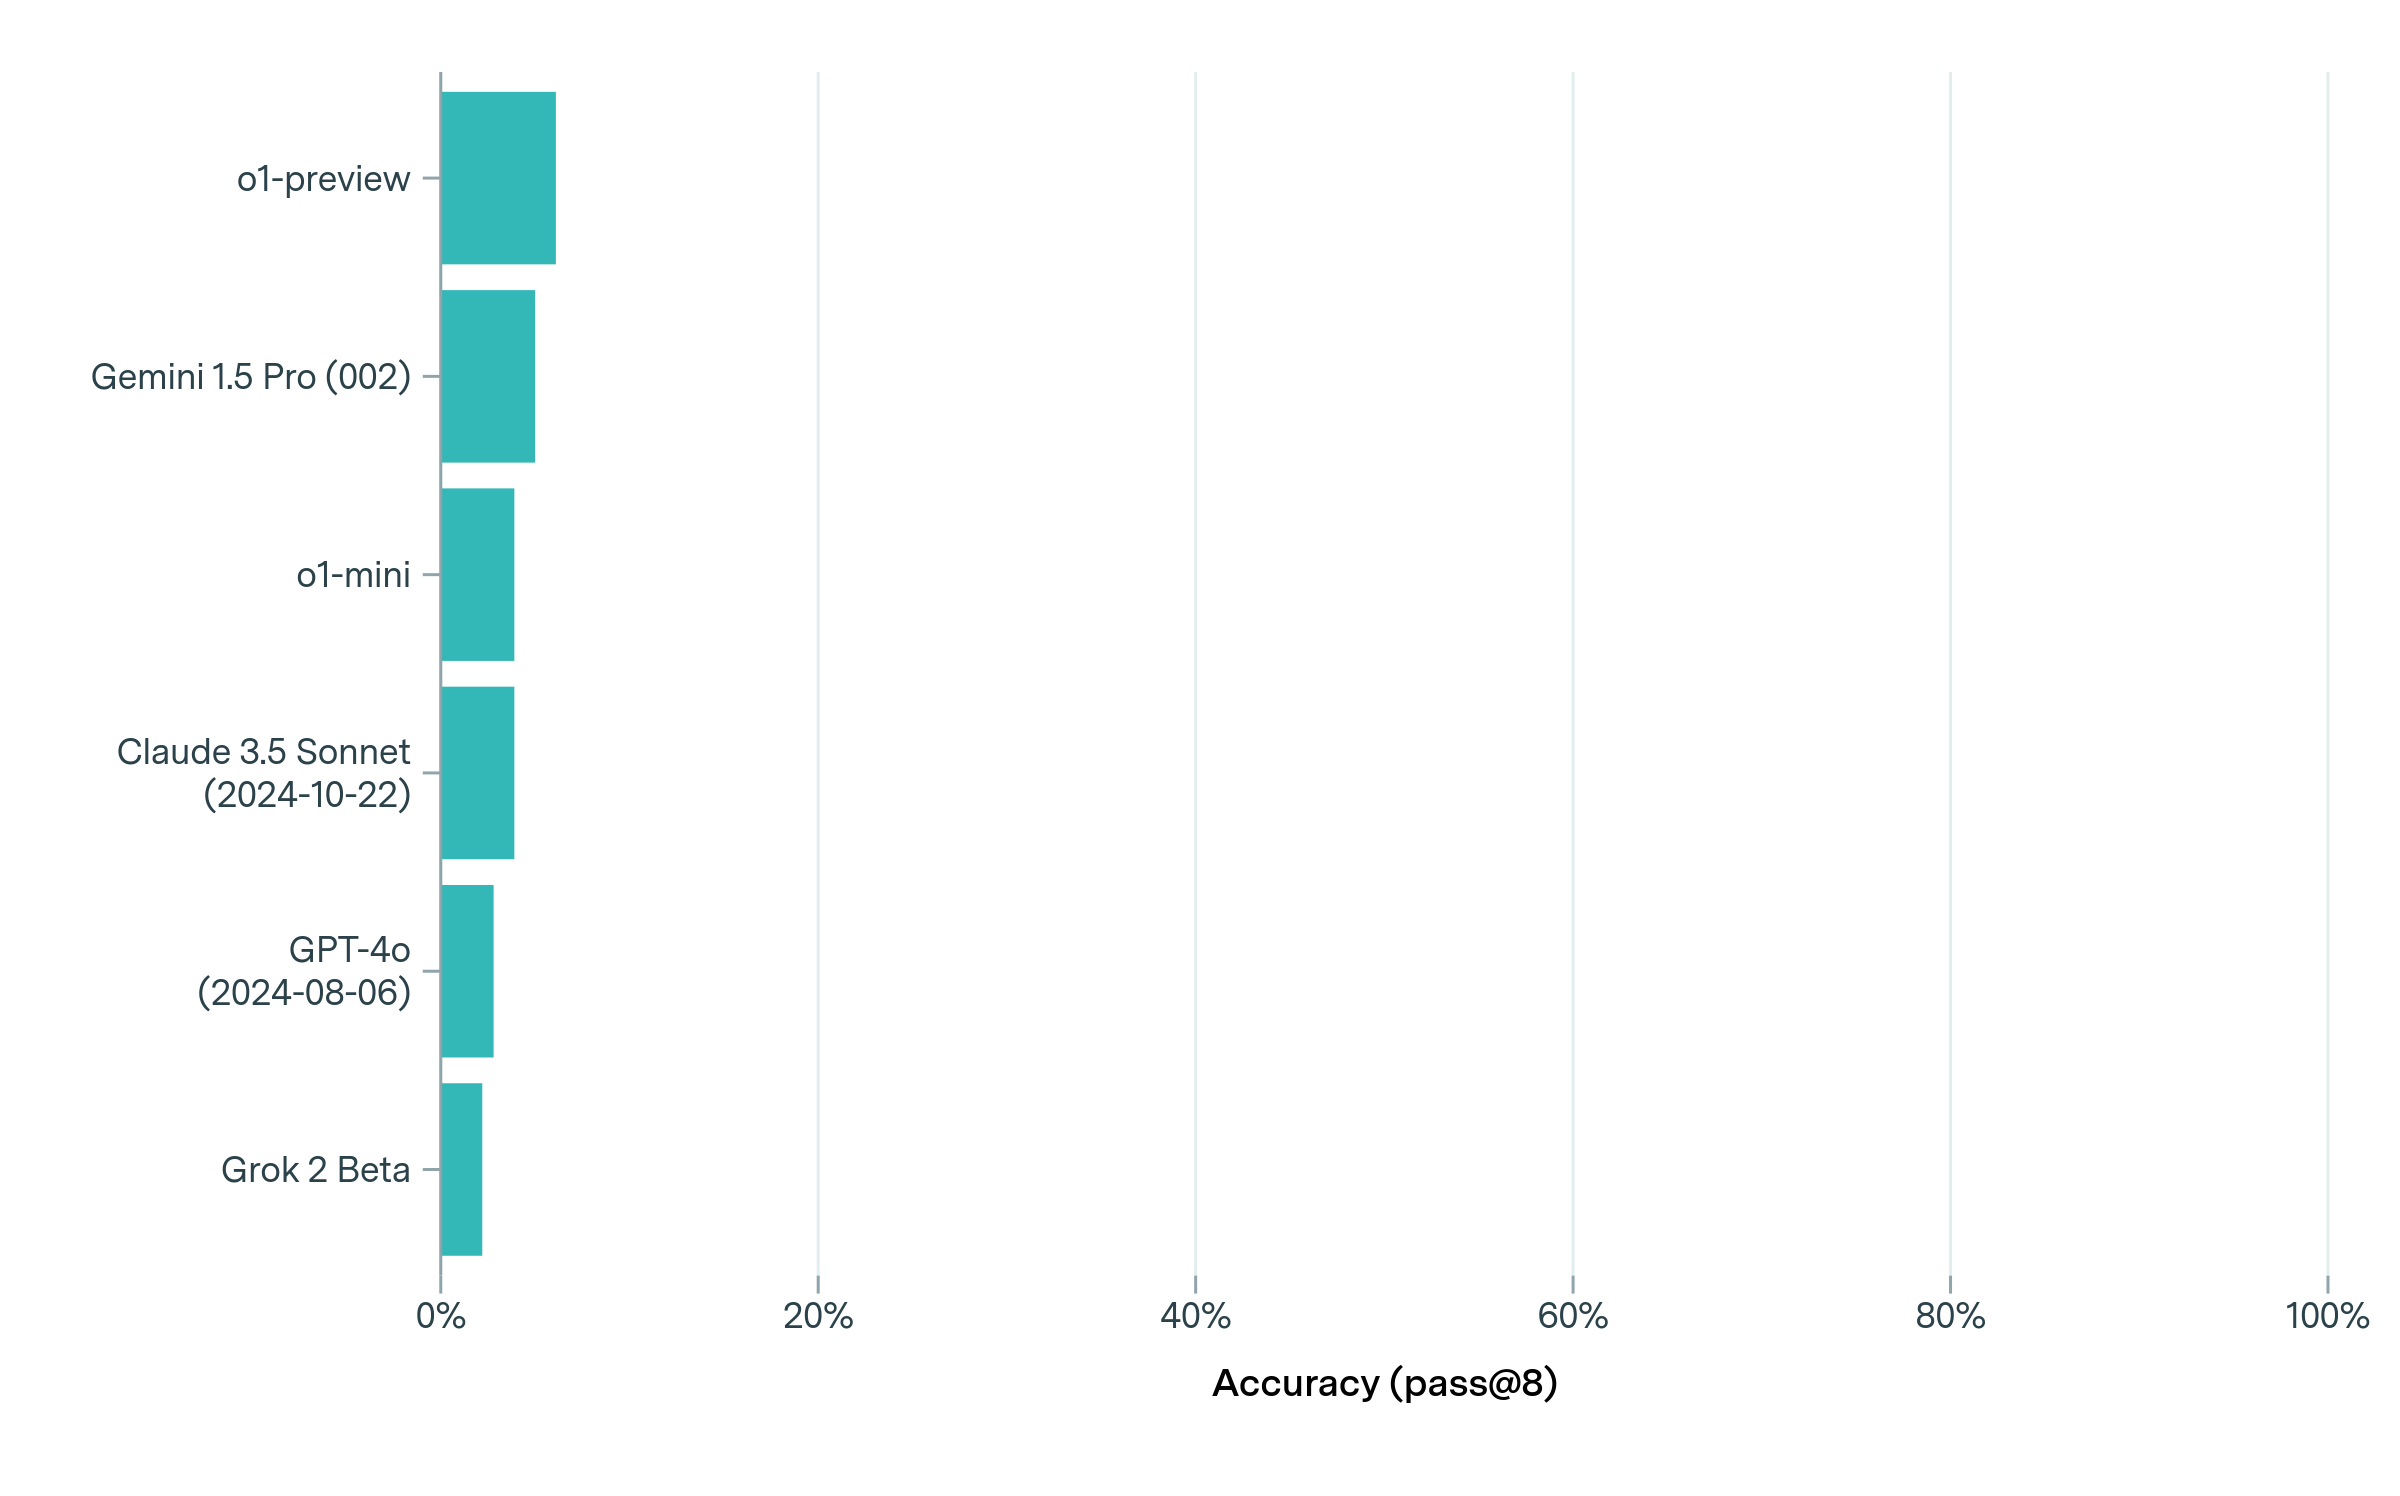
The image is a horizontal bar chart comparing the accuracy of several language models. The y-axis lists the models, and the x-axis represents accuracy, measured as "pass@8". The bars are all the same color (teal).
### Components/Axes
* **Y-axis (Labels):** Lists the language models being compared.
* o1-preview
* Gemini 1.5 Pro (002)
* o1-mini
* Claude 3.5 Sonnet (2024-10-22)
* GPT-4o (2024-08-06)
* Grok 2 Beta
* **X-axis (Accuracy):** Represents the accuracy (pass@8) in percentage.
* Scale: 0%, 20%, 40%, 60%, 80%, 100%
* **Bars:** Teal bars represent the accuracy of each model.
### Detailed Analysis
Here's a breakdown of the approximate accuracy for each model, based on the bar lengths:
* **o1-preview:** Approximately 12% accuracy.
* **Gemini 1.5 Pro (002):** Approximately 9% accuracy.
* **o1-mini:** Approximately 7% accuracy.
* **Claude 3.5 Sonnet (2024-10-22):** Approximately 6% accuracy.
* **GPT-4o (2024-08-06):** Approximately 4% accuracy.
* **Grok 2 Beta:** Approximately 3% accuracy.
### Key Observations
* The "o1-preview" model has the highest accuracy among the models listed, at approximately 12%.
* "Grok 2 Beta" has the lowest accuracy, at approximately 3%.
* The accuracy values are relatively low across all models, with none exceeding 15%.
### Interpretation
The chart provides a comparison of the accuracy of different language models based on the "pass@8" metric. The data suggests that there is a significant difference in performance between the models, with "o1-preview" performing noticeably better than the others. The low accuracy values across all models could indicate that the task used to evaluate "pass@8" is challenging, or that the models are not optimized for this specific metric. The dates associated with some models (Claude 3.5 Sonnet and GPT-4o) suggest that these are specific versions of the models, which could influence their performance.