\n
## Bar Chart: Model Accuracy Comparison
### Overview
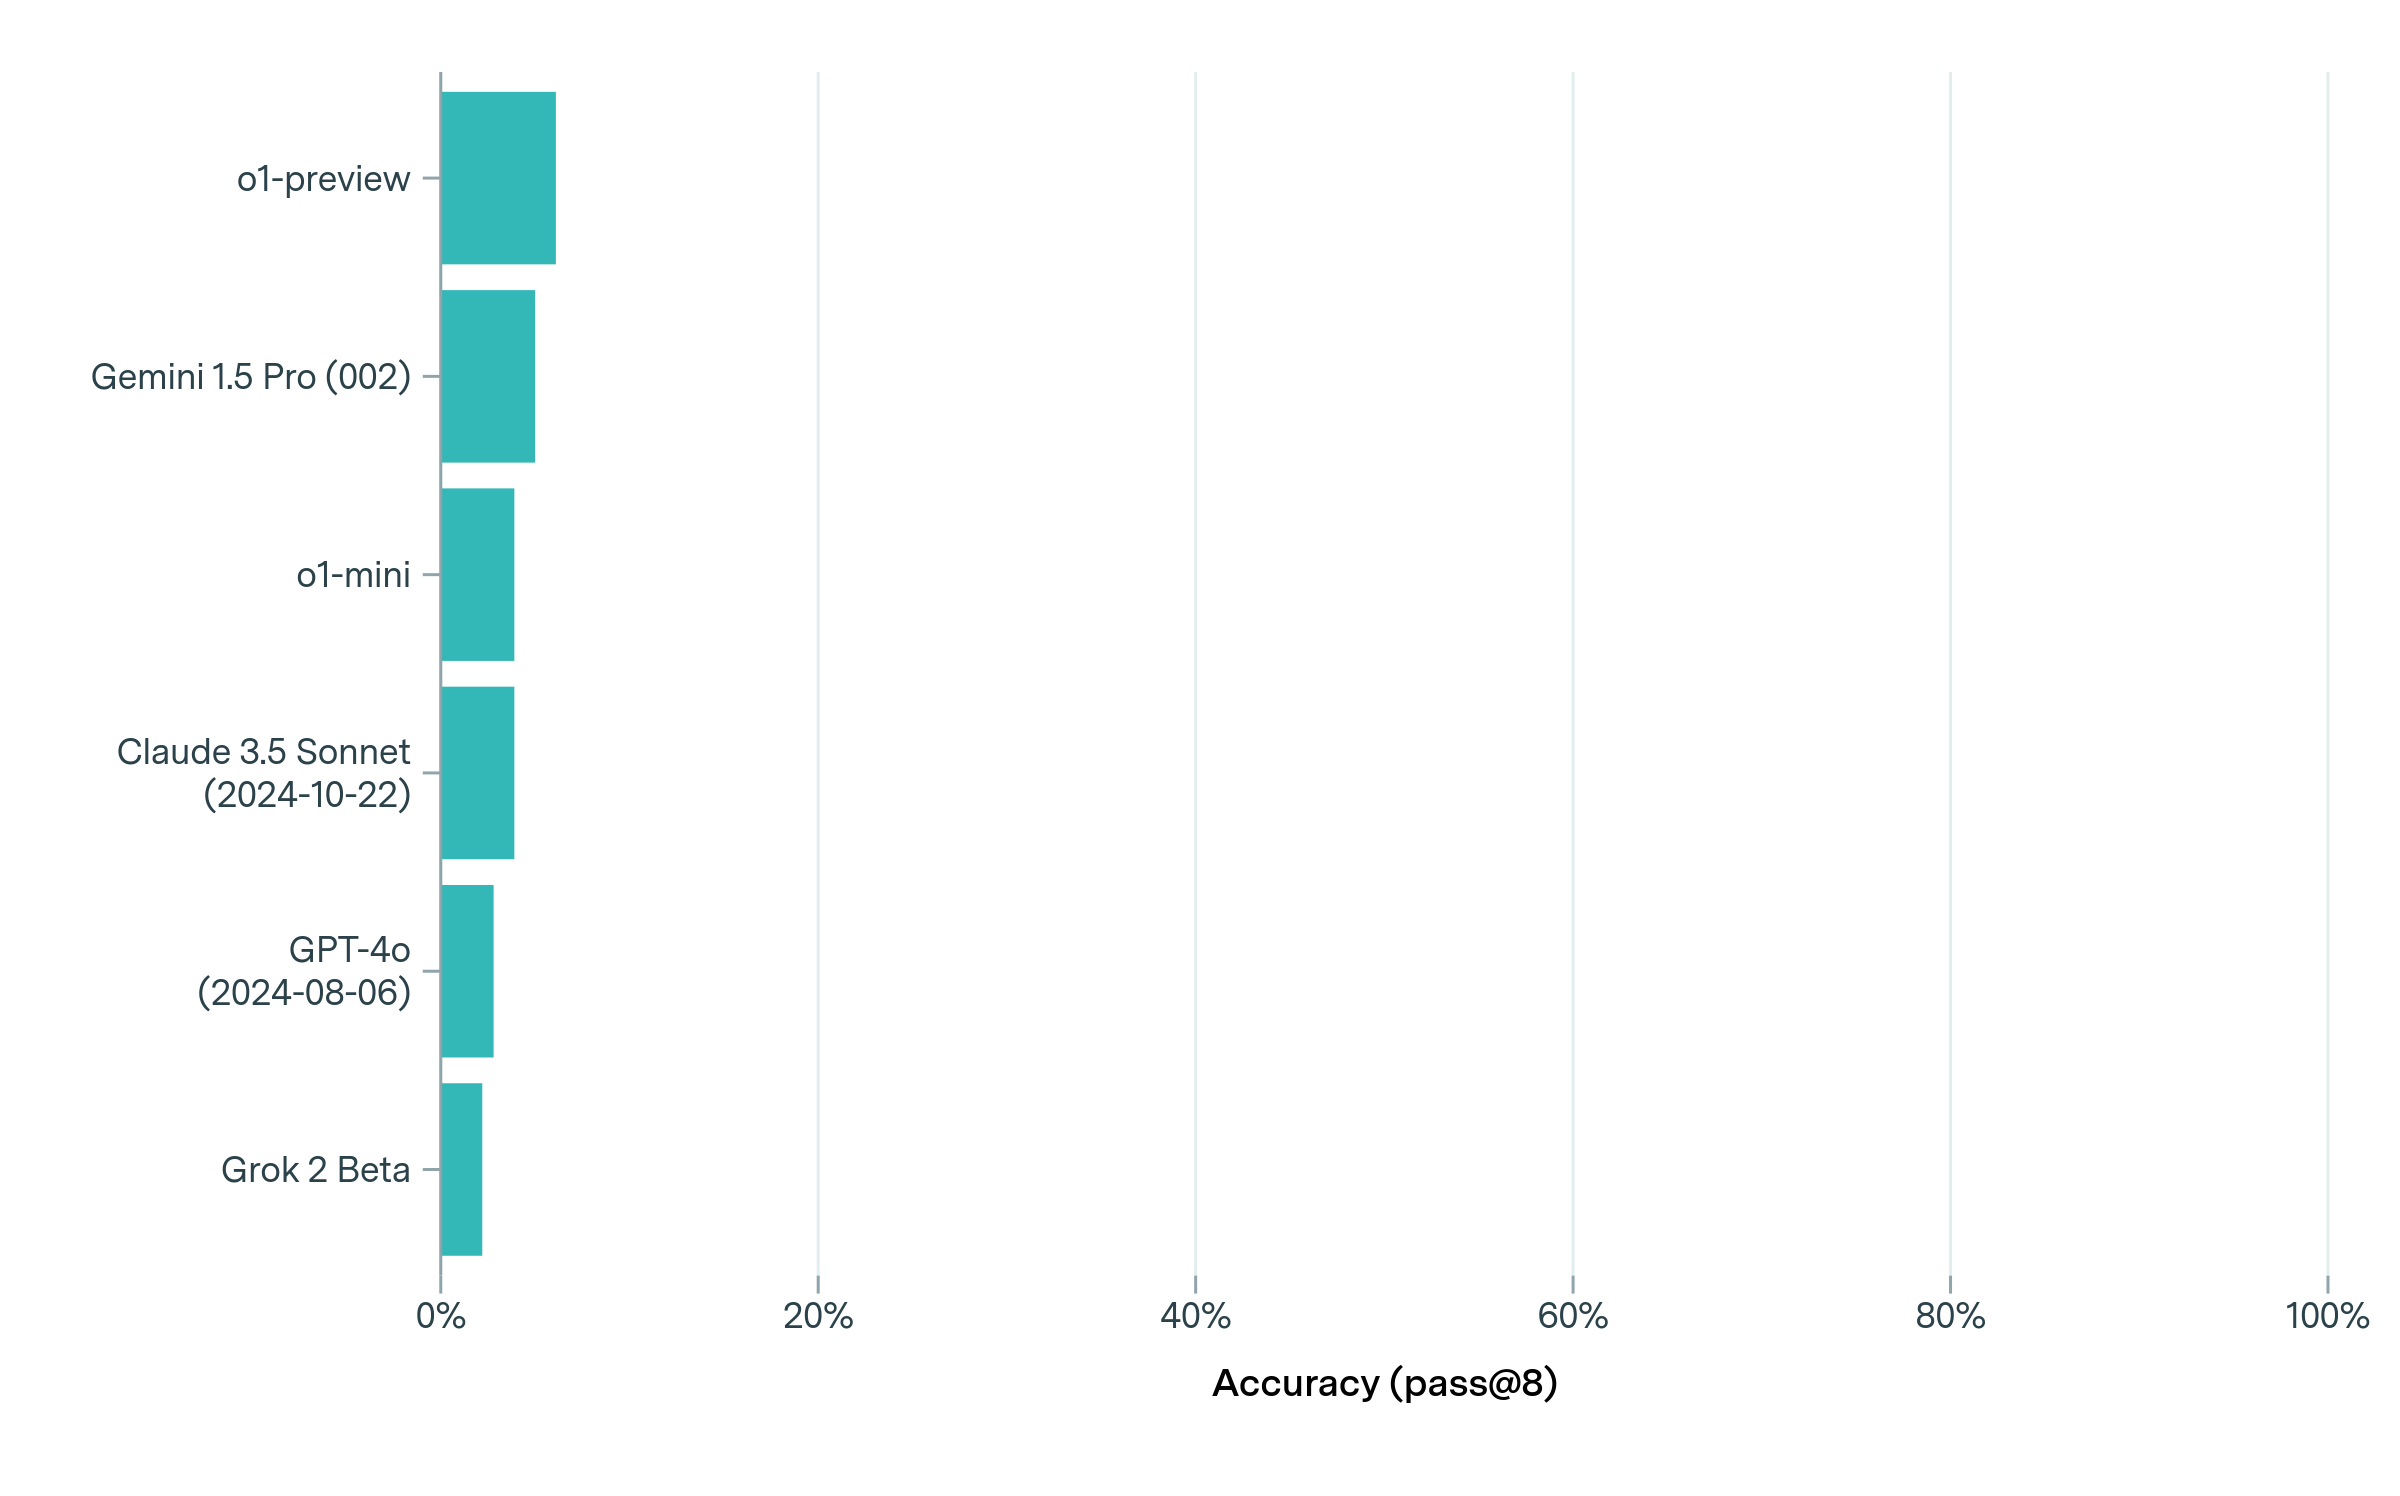
The image presents a horizontal bar chart comparing the accuracy of several large language models (LLMs) on a specific task. The accuracy metric used is "pass@8", which likely refers to the percentage of times the model produces a correct answer within its top 8 attempts. The chart displays the models' performance in a visually comparative manner.
### Components/Axes
* **Y-axis (Vertical):** Lists the names of the LLMs being compared:
* o1-preview
* Gemini 1.5 Pro (002)
* o1-mini
* Claude 3.5 Sonnet (2024-10-22)
* GPT-4o (2024-08-06)
* Grok 2 Beta
* **X-axis (Horizontal):** Represents the accuracy percentage, ranging from 0% to 100%, with gridlines at 20%, 40%, 60%, 80%, and 100%. The axis is labeled "Accuracy (pass@8)".
* **Bars:** Each bar corresponds to a model, with its length representing its accuracy score. The bars are colored in shades of teal.
### Detailed Analysis
Let's analyze each model's accuracy based on the bar lengths:
* **o1-preview:** The bar extends to approximately 83% ± 2%.
* **Gemini 1.5 Pro (002):** The bar extends to approximately 75% ± 2%.
* **o1-mini:** The bar extends to approximately 60% ± 2%.
* **Claude 3.5 Sonnet (2024-10-22):** The bar extends to approximately 50% ± 2%.
* **GPT-4o (2024-08-06):** The bar extends to approximately 40% ± 2%.
* **Grok 2 Beta:** The bar extends to approximately 25% ± 2%.
The bars are arranged from highest accuracy (o1-preview) to lowest accuracy (Grok 2 Beta).
### Key Observations
* **Performance Leader:** o1-preview significantly outperforms all other models, achieving the highest accuracy.
* **Gemini 1.5 Pro:** Gemini 1.5 Pro shows strong performance, ranking second in accuracy.
* **GPT-4o and Claude 3.5 Sonnet:** These models exhibit moderate accuracy, falling in the middle range.
* **Grok 2 Beta:** Grok 2 Beta demonstrates the lowest accuracy among the models tested.
* **Date Information:** The chart includes dates associated with Claude 3.5 Sonnet (2024-10-22) and GPT-4o (2024-08-06), suggesting these represent specific versions or snapshots of the models.
### Interpretation
This chart provides a comparative assessment of the accuracy of several LLMs using the "pass@8" metric. The substantial difference in performance between o1-preview and the other models suggests it possesses a significant advantage in the task being evaluated. The inclusion of dates for Claude 3.5 Sonnet and GPT-4o implies that model performance can evolve over time, and the chart captures a specific point in their development. The relatively low accuracy of Grok 2 Beta may indicate it is an earlier or less refined version compared to the others.
The "pass@8" metric is interesting. It suggests that while the models may not always provide the correct answer on the first attempt, they are capable of generating it within a limited number of tries. This could be relevant in applications where multiple responses are acceptable or where a post-processing step can filter for the correct answer.
The chart doesn't reveal *what* task the models are being evaluated on, which limits the scope of interpretation. Knowing the task would provide valuable context for understanding the significance of the accuracy differences.