## Horizontal Bar Chart: AI Model Accuracy Comparison (pass@8)
### Overview
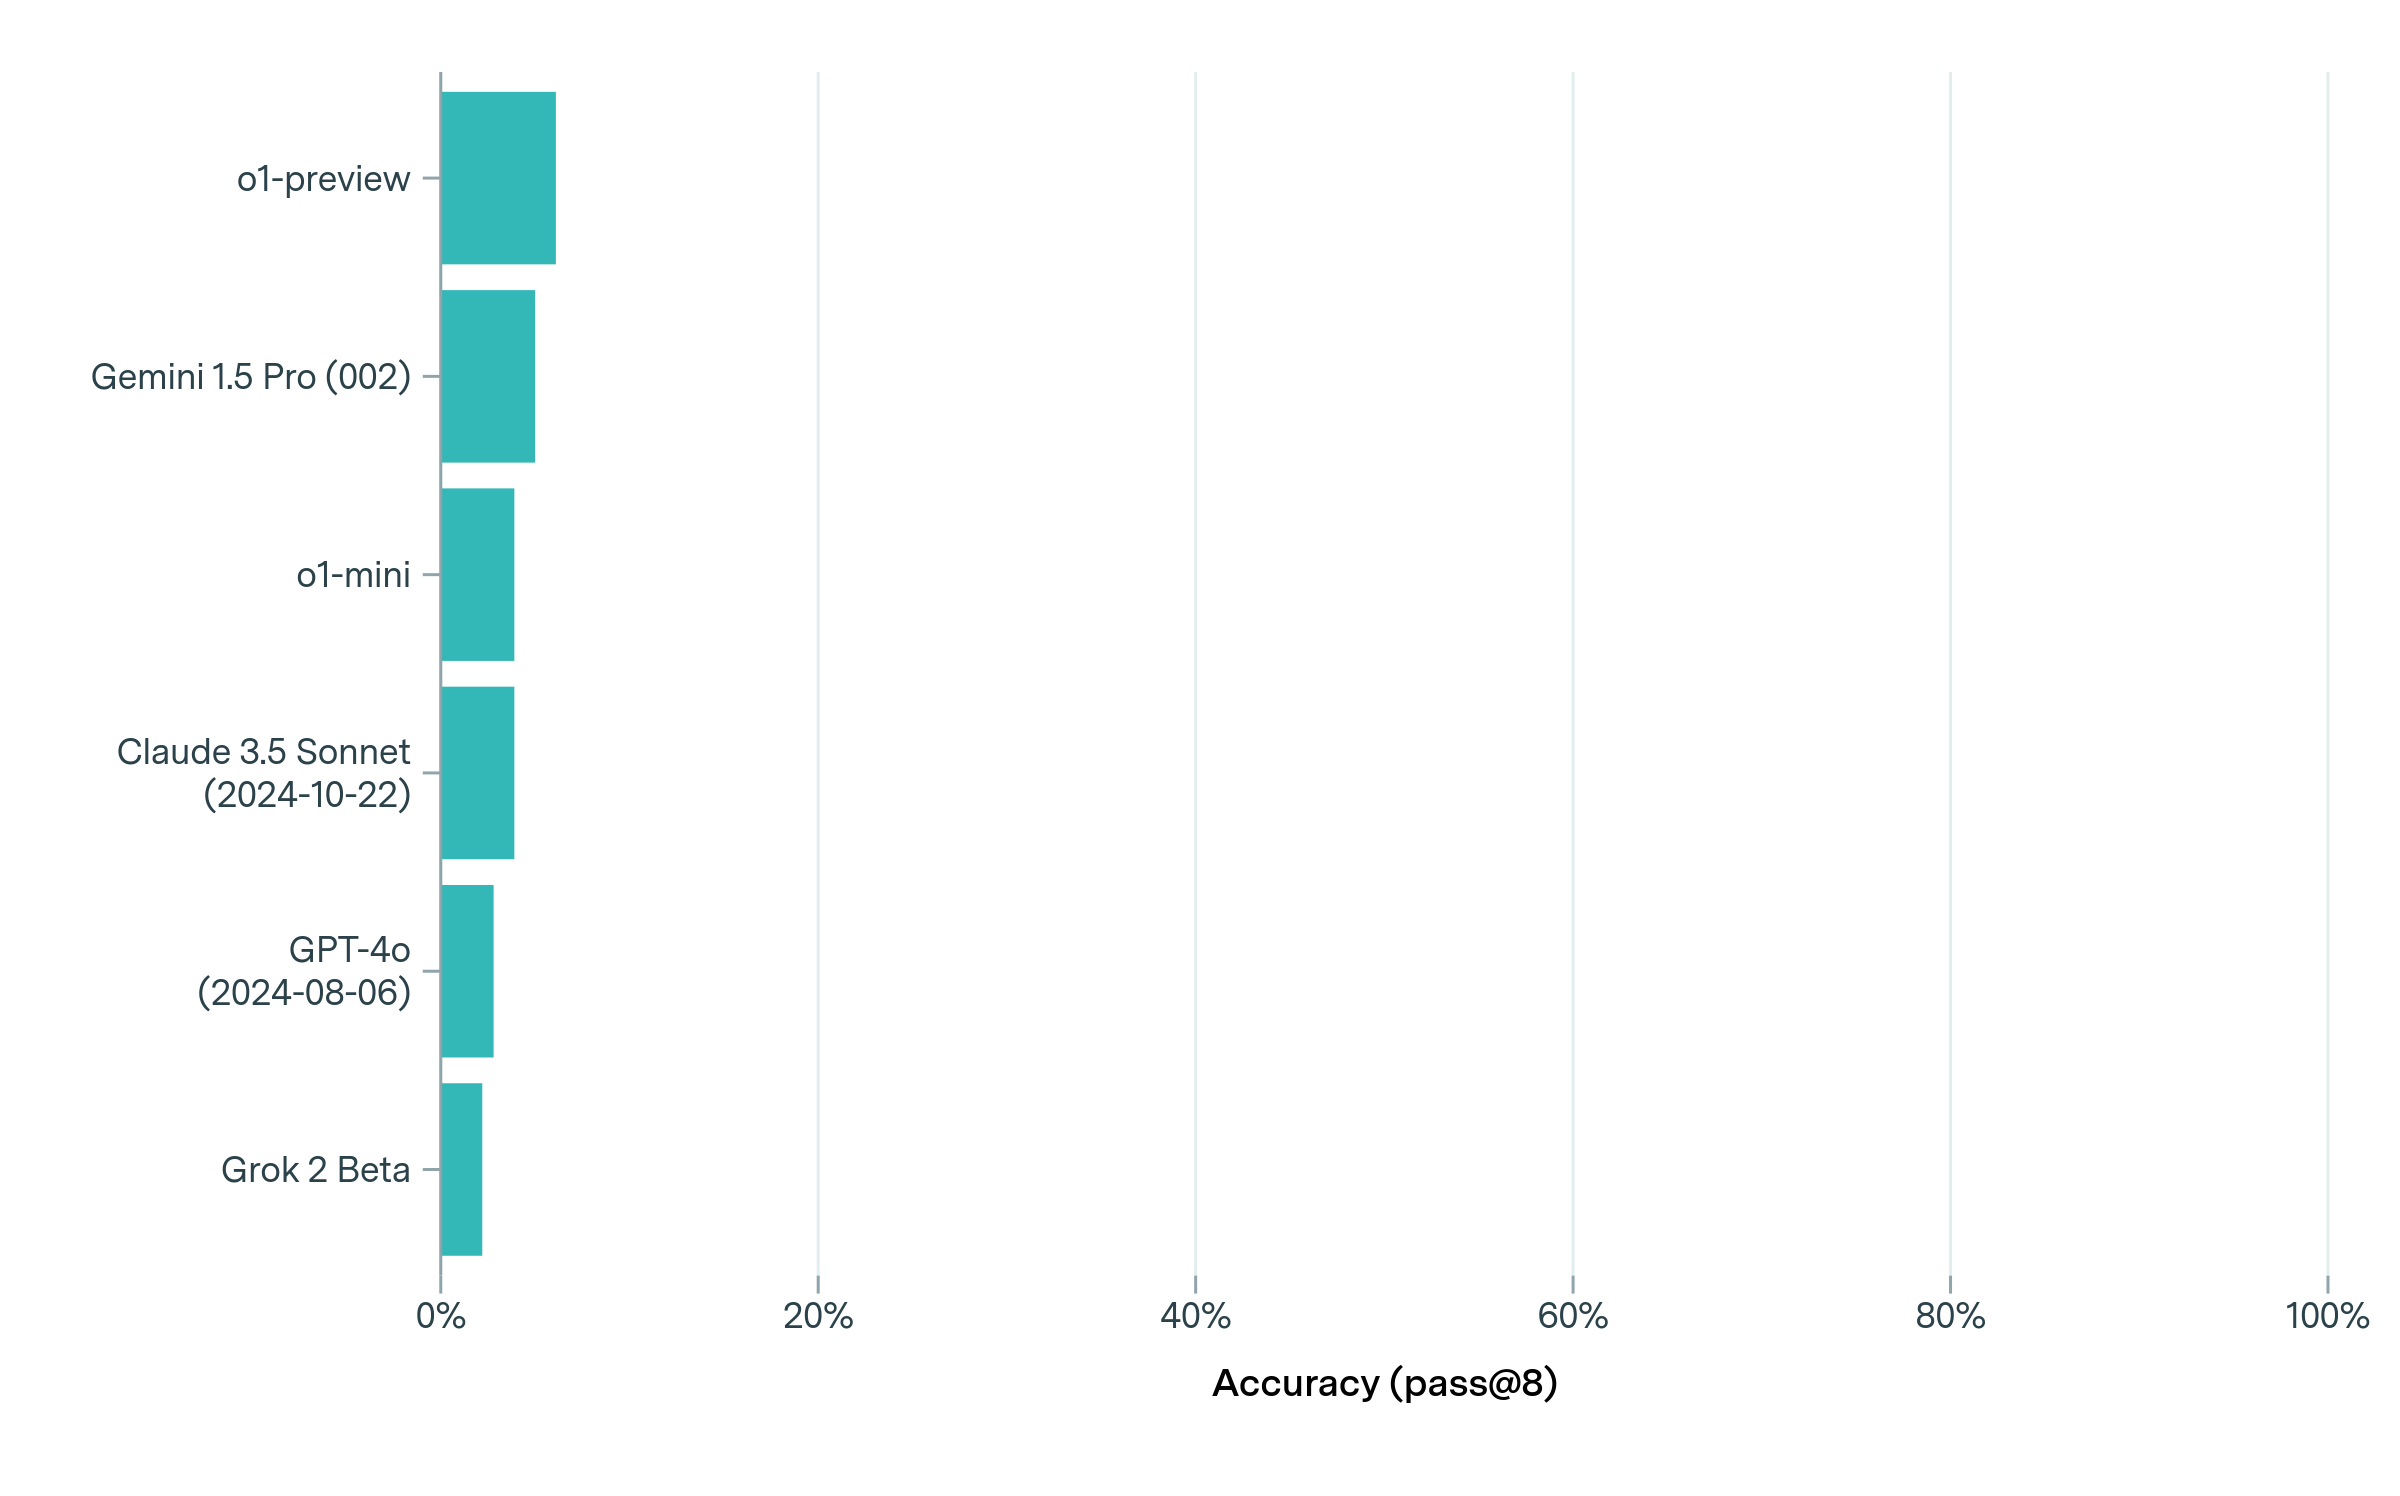
The image displays a horizontal bar chart comparing the performance of six different AI models. The chart measures "Accuracy (pass@8)" on a percentage scale from 0% to 100%. All bars are a uniform teal color, indicating a single data series. The visual presentation is minimalist, with a white background and light gray vertical grid lines at 20% intervals.
### Components/Axes
* **Chart Type:** Horizontal Bar Chart.
* **Y-Axis (Vertical):** Lists the names of six AI models. From top to bottom:
1. `o1-preview`
2. `Gemini 1.5 Pro (002)`
3. `o1-mini`
4. `Claude 3.5 Sonnet (2024-10-22)`
5. `GPT-4o (2024-08-06)`
6. `Grok 2 Beta`
* **X-Axis (Horizontal):** Labeled **"Accuracy (pass@8)"**. It has major tick marks and labels at:
* `0%`
* `20%`
* `40%`
* `60%`
* `80%`
* `100%`
* **Legend:** Not present. All bars share the same color, representing a single metric.
* **Grid:** Light gray vertical lines extend from each x-axis tick mark (0%, 20%, etc.) to the top of the chart area.
### Detailed Analysis
The chart presents the accuracy scores for each model. The bars are ordered from highest to lowest accuracy. All scores are visually estimated to be below 10%, indicating very low performance on this specific metric.
**Estimated Values (with uncertainty):**
* **o1-preview:** The bar extends the furthest. Visually, it appears to be approximately **7-8%**.
* **Gemini 1.5 Pro (002):** The second-longest bar. Estimated at **5-6%**.
* **o1-mini:** Slightly shorter than Gemini. Estimated at **4-5%**.
* **Claude 3.5 Sonnet (2024-10-22):** Very similar in length to o1-mini. Estimated at **4-5%**.
* **GPT-4o (2024-08-06):** Noticeably shorter than the previous two. Estimated at **3-4%**.
* **Grok 2 Beta:** The shortest bar. Estimated at **2-3%**.
**Trend Verification:** The visual trend is a clear, stepwise descending order from top to bottom. Each subsequent model's bar is slightly shorter than the one above it, confirming the ranking from highest to lowest accuracy.
### Key Observations
1. **Low Overall Accuracy:** All six models demonstrate very low accuracy on this "pass@8" benchmark, with the top performer (o1-preview) scoring below 10%.
2. **Tight Clustering:** The performance differences between the models are relatively small. The gap between the top model (o1-preview) and the bottom model (Grok 2 Beta) is only about 5 percentage points.
3. **Clear Hierarchy:** Despite the small margins, a distinct performance hierarchy is visible: o1-preview > Gemini 1.5 Pro > o1-mini ≈ Claude 3.5 Sonnet > GPT-4o > Grok 2 Beta.
4. **Specific Model Versions:** The chart specifies version dates for some models (Claude 3.5 Sonnet and GPT-4o), indicating the comparison is between specific releases.
### Interpretation
This chart likely represents results from a challenging technical benchmark or task, given the uniformly low "pass@8" accuracy scores. The "pass@8" metric typically means the model is given 8 attempts to generate a correct solution, and the score reflects the percentage of problems where at least one of the 8 attempts is correct.
The data suggests that for this particular task, current leading AI models are far from reliable, with even the best model succeeding less than 1 in 10 times on average. The tight clustering indicates that model architecture or training differences among these top contenders yield only marginal improvements on this specific challenge. The inclusion of model version dates implies that performance on this metric may be sensitive to specific updates or releases. The absence of any model scoring near the 100% mark highlights a significant gap in capability for the evaluated domain.