## Horizontal Bar Chart: Model Accuracy (pass@8) Comparison
### Overview
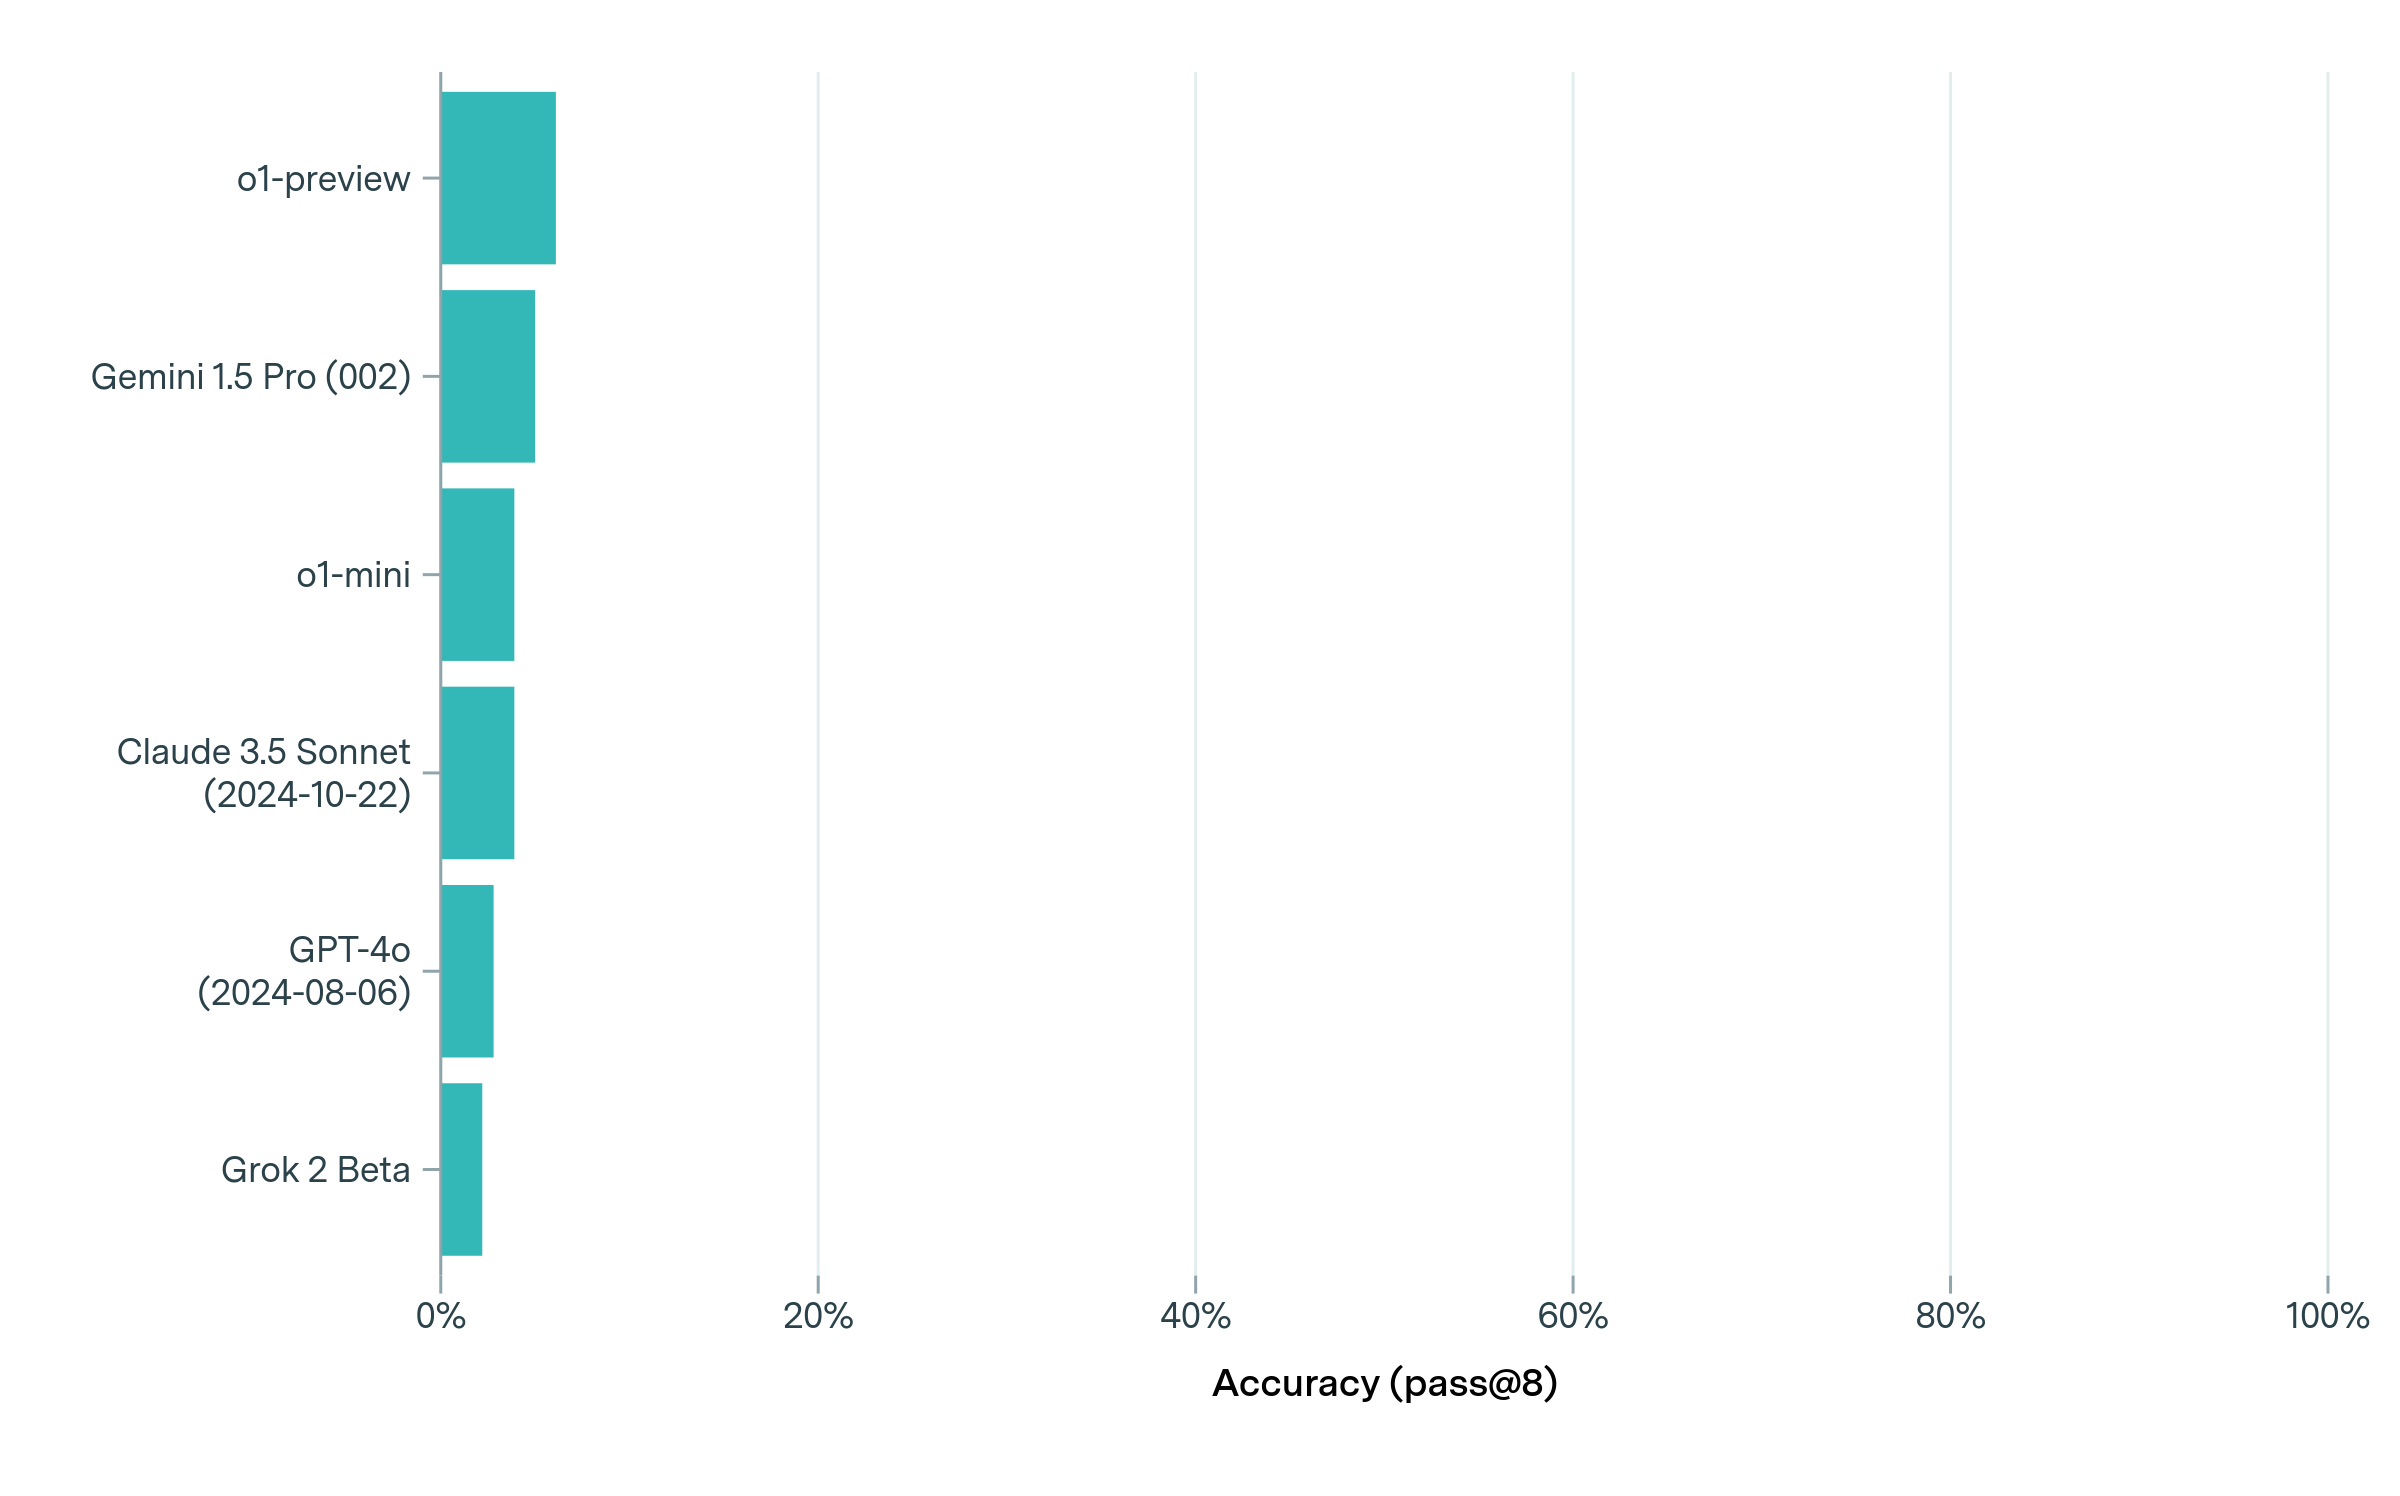
The image is a horizontal bar chart comparing the accuracy (pass@8) of six different AI models. The x-axis represents accuracy as a percentage (0% to 100%), while the y-axis lists model names. All bars are teal-colored, and the chart emphasizes relative performance differences between models.
### Components/Axes
- **X-axis (Accuracy)**: Labeled "Accuracy (pass@8)" with percentage markers at 0%, 20%, 40%, 60%, 80%, and 100%.
- **Y-axis (Models)**: Lists six AI models in descending order of bar length:
1. o1-preview
2. Gemini 1.5 Pro (002)
3. o1-mini
4. Claude 3.5 Sonnet (2024-10-22)
5. GPT-4o (2024-08-06)
6. Grok 2 Beta
- **Legend**: A single teal-colored bar labeled "Accuracy" is present on the right side of the chart.
### Detailed Analysis
- **Bar Lengths**:
- **o1-preview**: Longest bar, reaching approximately **8-10%** accuracy.
- **Gemini 1.5 Pro (002)**: Second-longest, around **6-7%**.
- **o1-mini**: ~5-6% accuracy.
- **Claude 3.5 Sonnet (2024-10-22)**: ~4-5%.
- **GPT-4o (2024-08-06)**: ~3-4%.
- **Grok 2 Beta**: Shortest bar, ~2-3% accuracy.
- **Spatial Grounding**:
- The legend is positioned on the right, matching the teal color of all bars.
- Model names are left-aligned on the y-axis, with dates in parentheses for newer models.
### Key Observations
1. **Low Overall Accuracy**: All models show very low pass@8 accuracy (<10%), suggesting they may not be optimized for this specific metric.
2. **Performance Hierarchy**:
- o1-preview outperforms others by ~2-3 percentage points.
- Grok 2 Beta is the weakest performer.
3. **Temporal Context**: Newer models (e.g., Claude 3.5 Sonnet, GPT-4o) do not consistently outperform older ones, indicating no clear trend in improvement over time.
### Interpretation
The chart highlights significant variability in model performance for the pass@8 metric, which measures the ability to correctly answer 8 out of 10 questions. The low accuracy across all models suggests this task is challenging for current AI systems, or the metric may not align with their training objectives. The absence of a clear upward trend in newer models implies that architectural or training improvements may not directly correlate with pass@8 performance. This could indicate a need for reevaluating evaluation criteria or focusing on alternative metrics for model assessment.