## Light Curve Analysis: KMT-2017-BLG-1003
### Overview
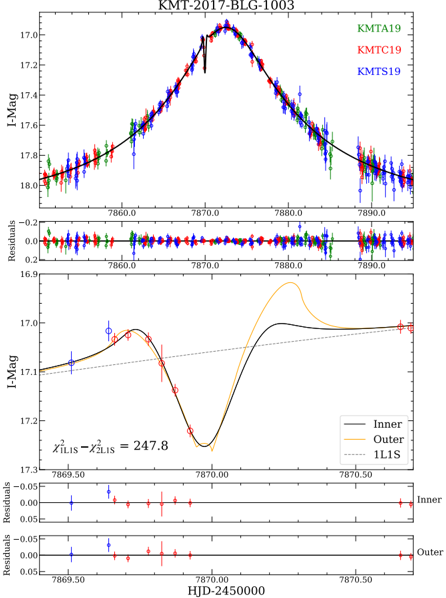
The image presents a light curve analysis of the astronomical object KMT-2017-BLG-1003. It includes two main plots showing the I-band magnitude (I-Mag) variations over time (HJD-2450000), along with residual plots indicating the difference between the observed data and model fits. The analysis involves fitting different models (Inner, Outer, 1L1S) to the observed data from three different telescopes (KMTA19, KMTC19, KMTS19).
### Components/Axes
* **Top Plot:**
* **Title:** KMT-2017-BLG-1003
* **Y-axis:** I-Mag (I-band magnitude), ranging from approximately 17.0 to 18.0. Note that magnitude decreases upwards.
* **X-axis:** HJD-2450000 (Heliocentric Julian Date minus 2450000), ranging from approximately 7860.0 to 7890.0.
* **Data Series:**
* KMTA19 (Green): Data points from the KMTA19 telescope.
* KMTC19 (Red): Data points from the KMTC19 telescope.
* KMTS19 (Blue): Data points from the KMTS19 telescope.
* Black Line: Model fit to the data.
* **Residuals Plot (Top):** Residuals corresponding to the top plot, with the same x-axis. Y-axis ranges from -0.2 to 0.2.
* **Bottom Plot:**
* **Y-axis:** I-Mag, ranging from approximately 16.9 to 17.3.
* **X-axis:** HJD-2450000, ranging from approximately 7869.50 to 7870.50.
* **Data Series:**
* Inner (Black): Model fit representing the "Inner" region.
* Outer (Orange/Yellow): Model fit representing the "Outer" region.
* 1L1S (Dashed Gray): Model fit representing the "1L1S" model.
* **Residuals Plots (Bottom):** Two residual plots corresponding to the "Inner" and "Outer" models, with the same x-axis. Y-axis ranges from -0.05 to 0.05 for both.
* **Equation:** χ²₁L₁S - χ²₂L₁S = 247.8
### Detailed Analysis
* **Top Plot Data:**
* The data points from KMTA19 (Green), KMTC19 (Red), and KMTS19 (Blue) show a clear dip in magnitude around HJD-2450000 = 7870, indicating a brightening event.
* The black line represents a model fit to the combined data. It captures the overall trend of the light curve.
* The residuals in the top plot are generally close to zero, indicating a good fit of the model to the data.
* **Bottom Plot Data:**
* The bottom plot focuses on a smaller time range around the brightening event.
* The "Inner" (Black) and "Outer" (Orange/Yellow) models show different fits to the data, particularly around the peak of the brightening.
* The "1L1S" (Dashed Gray) model appears to be a linear fit.
* The residuals for the "Inner" and "Outer" models are shown in the bottom two plots.
### Key Observations
* The light curve shows a significant brightening event around HJD-2450000 = 7870.
* The different models ("Inner," "Outer," "1L1S") provide varying fits to the data, suggesting different interpretations of the event.
* The equation χ²₁L₁S - χ²₂L₁S = 247.8 likely represents a comparison of the goodness-of-fit between two models (1L1S and 2L1S), with a significant difference indicating that the 2L1S model is a better fit.
### Interpretation
The light curve analysis of KMT-2017-BLG-1003 reveals a microlensing event. The brightening observed around HJD-2450000 = 7870 is caused by the gravitational lensing of a background star by a foreground object. The different models ("Inner," "Outer," "1L1S") likely represent different assumptions about the lens system, such as the presence of a binary lens or a planet orbiting the lens star. The residuals plots help assess the quality of each model fit. The equation χ²₁L₁S - χ²₂L₁S = 247.8 suggests that a more complex model (2L1S) provides a significantly better fit to the data than a simpler model (1L1S), indicating a more complex lens system.