## Light Curve Analysis: KMT-2017-BLG-1003
### Overview
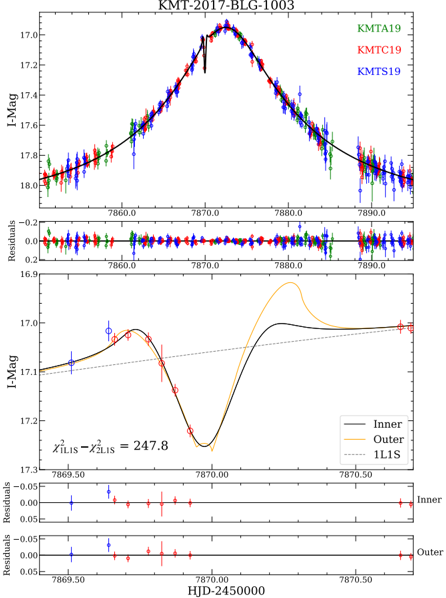
The image presents a light curve analysis of the microlensing event KMT-2017-BLG-1003. It consists of two main panels, each containing a light curve plot and corresponding residuals. The top panel shows the full light curve with data from multiple telescopes, while the bottom panel focuses on a zoomed-in region around the peak of the event. The data is presented as magnitude (I-Mag) versus time (HJD-2450000).
### Components/Axes
* **X-axis (Both Panels):** HJD-2450000 (Heliocentric Julian Date minus 2450000). Scale ranges from approximately 7860 to 7890 in the top panel and 7869.5 to 7870.5 in the bottom panel.
* **Y-axis (Top & Bottom Panels):** I-Mag (Magnitude in the I-band). Scale ranges from approximately 16.9 to 18.1 in the top panel and 16.9 to 17.2 in the bottom panel.
* **Top Panel Data Series:**
* KMTA19 (Red)
* KMTC19 (Green)
* KMTS19 (Blue)
* **Bottom Panel Data Series:**
* Inner (Black)
* Outer (Orange)
* 1LIS (Gray)
* **Residuals Plots (Both Panels):** Display the difference between the observed data and the model fit. Y-axis ranges from -0.2 to 0.2 in the top panel and -0.05 to 0.05 in the bottom panel.
* **Equation:** χ²<sub>1LIS</sub> - χ²<sub>2LIS</sub> = 247.8 (located in the bottom panel)
* **Legend:** Located in the top-right corner for the top panel data series and bottom-right corner for the bottom panel data series.
### Detailed Analysis or Content Details
**Top Panel:**
* **KMTA19 (Red):** The data points show a general upward trend from approximately 7860 to a peak around 7870, followed by a downward trend to 7890. Values range from approximately 17.8 at 7860 to 17.2 at 7870, then back to 18.0 at 7890. Significant scatter is present.
* **KMTC19 (Green):** Similar trend to KMTA19, but with more scatter. Values range from approximately 17.9 at 7860 to 17.3 at 7870, then back to 18.1 at 7890.
* **KMTS19 (Blue):** Also follows the same trend, with values ranging from approximately 18.0 at 7860 to 17.4 at 7870, then back to 18.2 at 7890.
* **Residuals (Top Panel):** The residuals are generally centered around zero, indicating a reasonable fit. Some scatter is visible, particularly around the peak of the light curve.
**Bottom Panel:**
* **Inner (Black):** A smooth curve representing the inner microlensing solution. It peaks sharply around HJD-2450000 = 7870.0, reaching a minimum magnitude of approximately 17.0.
* **Outer (Orange):** A broader, less pronounced curve representing the outer microlensing solution. It peaks around HJD-2450000 = 7870.0, reaching a minimum magnitude of approximately 17.1.
* **1LIS (Gray):** A line representing the 1LIS model. It is relatively flat and close to the Outer curve.
* **Residuals (Bottom Panel):** The residuals for both the Inner and Outer solutions are small and generally within the error bars.
### Key Observations
* The light curve exhibits a clear microlensing event with a distinct peak.
* The data from the three telescopes (KMTA19, KMTC19, KMTS19) are consistent with each other, although with varying degrees of scatter.
* The bottom panel shows two possible microlensing solutions: an "Inner" solution and an "Outer" solution. The Inner solution provides a better fit to the data, as indicated by the χ² value.
* The χ² difference of 247.8 suggests a statistically significant preference for the 1LIS model over the 2LIS model.
* The residuals are generally small, indicating that the models provide a good fit to the data.
### Interpretation
The data demonstrates a microlensing event caused by the gravitational lensing of a background star by a foreground object. The light curve shows the characteristic brightening of the background star as the lens passes close to its line of sight. The two solutions (Inner and Outer) represent different possible configurations of the lens and source stars. The significantly lower χ² value for the 1LIS model suggests that the "Inner" solution is the more likely scenario. The residuals analysis confirms the goodness of fit of the models to the observed data. The event is well-characterized by the data from the three telescopes, providing a robust measurement of the microlensing parameters. The event is identified as KMT-2017-BLG-1003. The data suggests a relatively close alignment between the lens and source stars, resulting in a significant brightening of the background star. The analysis provides valuable insights into the distribution of stars and compact objects in the Galactic bulge.