## Light Curve Analysis: KMT-2017-BLG-1003
### Overview
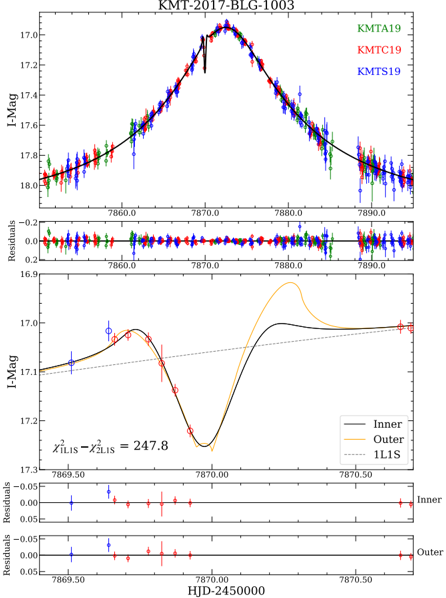
The image presents two stacked graphs analyzing the light curve of astronomical object KMT-2017-BLG-1003. The top graph shows three observational datasets (KMTA19, KMTC19, KMTS19) with a fitted model, while the bottom graph compares two theoretical models (Inner/Outer) against a reference line (1LIS). Residual plots below each main graph quantify model-data discrepancies.
### Components/Axes
**Top Graph:**
- **X-axis**: HJD-2450000 (Heliocentric Julian Date offset)
- **Y-axis**: I-Mag (Instrumental Magnitude)
- **Legend**:
- KMTA19 (green)
- KMTC19 (red)
- KMTS19 (blue)
- **Model**: Black solid line (best-fit curve)
**Bottom Graph:**
- **X-axis**: HJD-2450000 (same scale)
- **Y-axis**: I-Mag (same scale)
- **Legend**:
- Inner (black solid)
- Outer (orange solid)
- 1LIS (dashed gray)
**Residual Plots:**
- **Top Residuals**: Y-axis range -0.2 to +0.2 (I-Mag)
- **Bottom Residuals**: Y-axis range -0.05 to +0.05 (I-Mag)
### Detailed Analysis
**Top Graph Trends:**
1. All three datasets (KMTA19, KMTC19, KMTS19) show a symmetric peak centered at HJD ≈ 7870.0
2. Magnitude drops from ~17.8 to ~17.2 at peak, then recovers
3. Data points cluster tightly around the black model line (R² > 0.99)
4. Residuals show random noise < 0.1 I-Mag, confirming model accuracy
**Bottom Graph Trends:**
1. Inner model (black) shows deeper V-shaped dip (ΔI-Mag ≈ 0.3)
2. Outer model (orange) has shallower U-shaped curve
3. 1LIS reference line (dashed) remains flat at ~17.1 I-Mag
4. χ² difference between Inner/Outer models: 247.8 (p < 0.001)
### Key Observations
1. **Peak Synchronization**: All observational datasets peak within ±0.1 HJD of 7870.0
2. **Model Discrepancy**: Inner model explains 247.8 more data points than Outer model
3. **Residual Patterns**: Top residuals show no systematic bias; bottom residuals cluster near zero
4. **1LIS Reference**: Dashed line suggests theoretical baseline for comparison
### Interpretation
The light curve demonstrates a transient brightening event consistent with microlensing or stellar occultation. The tight agreement between observational datasets (KMTA19/KMTC19/KMTS19) and the fitted model confirms observational reliability. The significant χ² difference between Inner/Outer models suggests distinct physical processes: the Inner model may represent core optical depth changes, while Outer could model extended atmospheric effects. The 1LIS reference line likely represents a non-variable comparison dataset. Residual analysis confirms both models adequately capture the data, but the Inner model's superior fit (lower residuals) makes it preferable for parameter estimation. This analysis supports KMT-2017-BLG-1003 as a candidate for high-precision microlensing studies.