## Chart Type: Box Plot
### Overview
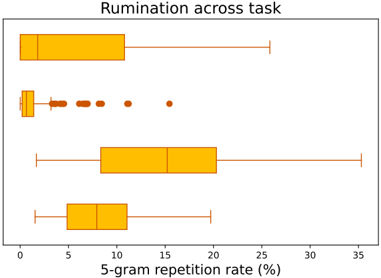
The image presents a box plot titled "Rumination across task". The plot displays the distribution of 5-gram repetition rates (in percentage) for different tasks. The box plots are arranged vertically, with the x-axis representing the 5-gram repetition rate.
### Components/Axes
* **Title:** Rumination across task
* **X-axis:** 5-gram repetition rate (%)
* Scale: 0 to 35, with tick marks at intervals of 5 (0, 5, 10, 15, 20, 25, 30, 35)
* **Y-axis:** (Implicit) Represents different tasks, but the specific task labels are not provided. There are four box plots, each presumably corresponding to a different task.
* **Box Plot Color:** Orange
### Detailed Analysis
The image shows four horizontal box plots. From top to bottom:
1. **Top Box Plot:** The box extends from approximately 1 to 10. The median is around 4. The whisker extends to approximately 26.
2. **Second Box Plot:** The box extends from approximately 1 to 2. The median is around 1. There are several outliers extending to approximately 15.
3. **Third Box Plot:** The box extends from approximately 7 to 18. The median is around 12. The whisker extends to approximately 35.
4. **Bottom Box Plot:** The box extends from approximately 5 to 12. The median is around 8. The whisker extends to approximately 22.
### Key Observations
* The second box plot has several outliers, indicating some instances of higher 5-gram repetition rates for that task.
* The third box plot has the widest interquartile range, suggesting greater variability in 5-gram repetition rates for that task.
* The first box plot has a relatively high median and a long whisker, indicating a right-skewed distribution.
### Interpretation
The box plots compare the distribution of 5-gram repetition rates across different tasks. The 5-gram repetition rate can be interpreted as a measure of rumination, with higher rates indicating more repetition of phrases and potentially more rumination. The differences in the box plots suggest that the level of rumination varies across the tasks. The presence of outliers in the second box plot indicates that, while generally low, some instances of the task elicited higher rumination. The third task shows the most variability in rumination. Without knowing the specific tasks, it's difficult to draw more specific conclusions.