\n
## Box Plot: Rumination across task
### Overview
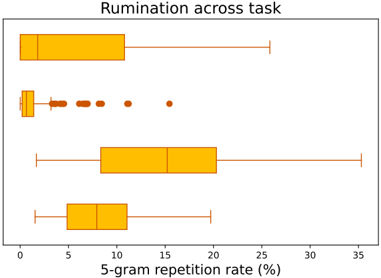
The image presents a box plot comparing the 5-gram repetition rate (%) across four different tasks. Each task is represented by a separate box plot, allowing for a visual comparison of the distribution of repetition rates.
### Components/Axes
* **Title:** "Rumination across task" - positioned at the top-center of the image.
* **X-axis Label:** "5-gram repetition rate (%)" - positioned at the bottom-center of the image. The scale ranges from 0 to 35.
* **Y-axis:** No explicit label, but represents the four different tasks. The tasks are arranged vertically.
* **Box Plots:** Four box plots, each representing a task. The box plots display the median, quartiles, and outliers for each task's 5-gram repetition rate.
* **Whiskers:** Extend from the boxes to indicate the range of the data, excluding outliers.
* **Outliers:** Represented as individual dots beyond the whiskers.
### Detailed Analysis
Let's analyze each box plot individually, starting from the top:
* **Task 1 (Top):** The box plot is centered around approximately 2-3%. The interquartile range (IQR) is relatively small, indicating a tight distribution. The whiskers extend to approximately 6% and 32%.
* **Task 2 (Second from Top):** This box plot shows a wider distribution. The median is around 7%. There are several outliers, ranging from approximately 8% to 16%. The whiskers extend to approximately 3% and 20%.
* **Task 3 (Third from Top):** The median is around 14%. The IQR is moderate. The whiskers extend to approximately 8% and 24%.
* **Task 4 (Bottom):** The median is around 10%. The IQR is relatively small. The whiskers extend to approximately 5% and 18%.
Approximate values extracted from visual inspection:
| Task | Minimum | Q1 | Median | Q3 | Maximum | Outliers |
|---|---|---|---|---|---|---|
| 1 | 2% | 2% | 3% | 4% | 32% | None |
| 2 | 3% | 6% | 7% | 12% | 20% | 8%, 9%, 11%, 16% |
| 3 | 8% | 11% | 14% | 17% | 24% | None |
| 4 | 5% | 8% | 10% | 13% | 18% | None |
### Key Observations
* Task 1 exhibits the lowest repetition rates overall.
* Task 2 has the most variability and the highest number of outliers, suggesting a greater tendency for rumination or repetitive thought patterns.
* Tasks 3 and 4 have similar median repetition rates, but Task 3 has a wider range.
* The distribution of Task 1 is more concentrated than the others.
### Interpretation
The data suggests that the four tasks elicit different levels of rumination, as measured by the 5-gram repetition rate. Task 1 appears to be the least prone to repetitive thought, while Task 2 is the most. The presence of outliers in Task 2 indicates that some individuals experience significantly higher repetition rates during that task.
The 5-gram repetition rate is likely used as a proxy for the degree to which individuals get "stuck" in repetitive thought loops. A higher rate suggests that individuals are more likely to revisit the same ideas or phrases, which is a hallmark of rumination.
The differences between tasks could be due to the nature of the tasks themselves. Some tasks may be more cognitively demanding or emotionally evocative, leading to increased rumination. Further investigation would be needed to understand the specific factors that contribute to these differences. The data does not provide information about the nature of the tasks, so this is speculative.