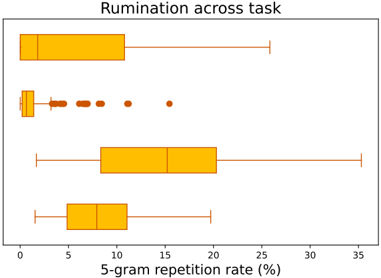
## Box Plot Chart: Rumination across task
### Overview
The image displays a box plot chart titled "Rumination across task" with four vertical orange box plots representing different categories on the y-axis. The x-axis measures "5-gram repetition rate (%)" from 0 to 35. The chart includes red outlier markers in the second plot.
### Components/Axes
- **X-axis**: "5-gram repetition rate (%)" with a linear scale from 0 to 35.
- **Y-axis**: Four unlabeled categories (positions 1–4 from top to bottom).
- **Legend**: Not visible in the image.
- **Colors**:
- Orange boxes (main data distributions).
- Red dots (outliers in the second plot).
### Detailed Analysis
1. **Top Plot (Category 1)**:
- Median: ~10%.
- Interquartile range (IQR): 5%–15%.
- Whiskers: 0%–25%.
- No outliers.
2. **Second Plot (Category 2)**:
- Median: ~1%.
- IQR: 0.5%–2%.
- Whiskers: 0%–5%.
- Outliers: 5 red dots at 2%, 3%, 4%, 5%, and 6%.
3. **Third Plot (Category 3)**:
- Median: ~15%.
- IQR: 10%–20%.
- Whiskers: 5%–35%.
- No outliers.
4. **Bottom Plot (Category 4)**:
- Median: ~9%.
- IQR: 5%–12%.
- Whiskers: 0%–20%.
- No outliers.
### Key Observations
- **Category 2** has the lowest median repetition rate (~1%) and the smallest IQR, with outliers extending slightly above 5%.
- **Category 3** exhibits the highest median (~15%) and widest range (5%–35%), indicating significant variability.
- **Categories 1 and 4** show similar medians (~10% and ~9%) but differ in IQR and whisker spread.
- Outliers in Category 2 suggest rare but notable deviations from the typical low repetition rate.
### Interpretation
The data suggests that rumination rates (as measured by 5-gram repetition) vary significantly across tasks. Category 3 demonstrates the highest typical repetition rate and greatest variability, potentially indicating higher cognitive load or task complexity. Category 2’s low median with outliers implies a generally low repetition rate but with occasional higher values. The similarity between Categories 1 and 4, with slight differences in medians and spreads, may reflect minor task-specific differences. The absence of a legend limits direct interpretation of category labels, but the spatial arrangement (top-to-bottom) and color consistency (orange boxes) support cross-category comparisons. The red outliers in Category 2 warrant further investigation to determine if they represent measurement errors or meaningful anomalies.