## Line Charts: Throughput vs Latency Trade-off and Throughput Gain per Batch Increase
### Overview
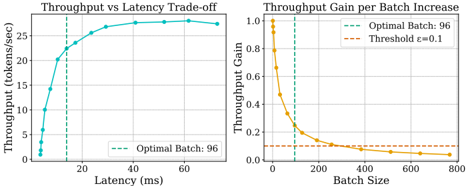
The image contains two line charts. The left chart illustrates the relationship between latency (ms) and throughput (tokens/sec), while the right chart shows how throughput gain changes with batch size. Both charts include labeled optimal thresholds and reference lines.
### Components/Axes
**Left Chart (Throughput vs Latency Trade-off):**
- **X-axis**: Latency (ms), ranging from 0 to 80 ms.
- **Y-axis**: Throughput (tokens/sec), ranging from 0 to 25 tokens/sec.
- **Legend**: Located at the bottom-right corner, labeled "Optimal Batch: 96" with a dashed cyan line.
- **Data Line**: Cyan color, plotted with markers. A vertical dashed cyan line marks the optimal latency at ~20 ms.
**Right Chart (Throughput Gain per Batch Increase):**
- **X-axis**: Batch Size, ranging from 0 to 800.
- **Y-axis**: Throughput Gain (unitless, 0 to 1.0).
- **Legend**: Located at the top-right corner, with two entries:
- Dashed cyan line: "Optimal Batch: 96"
- Dashed orange line: "Threshold ε=0.1"
- **Data Lines**:
- Orange line: Plotted with markers, showing a sharp decline.
- Cyan vertical dashed line: Marks the optimal batch size at 96.
### Detailed Analysis
**Left Chart Trends:**
- Throughput increases sharply from ~2 tokens/sec at 0 ms to ~25 tokens/sec at 20 ms.
- After 20 ms, throughput plateaus near 25 tokens/sec, with minor fluctuations.
- The optimal latency (20 ms) aligns with the peak throughput.
**Right Chart Trends:**
- Throughput gain starts at 1.0 for batch size 0, dropping sharply to ~0.2 at 100.
- The decline continues gradually, reaching ~0.05 at 800.
- The threshold ε=0.1 (orange dashed line) intersects the orange data line near batch size 100.
- The cyan vertical line at 96 indicates the optimal batch size.
### Key Observations
1. **Latency-Throughput Trade-off**: Throughput peaks at 20 ms latency and remains stable beyond this point.
2. **Batch Size Impact**: Throughput gain decreases non-linearly as batch size increases, with a critical drop below the ε=0.1 threshold near batch size 100.
3. **Optimal Configuration**: Both charts highlight 96 as the optimal batch size, balancing latency and throughput efficiency.
### Interpretation
The data demonstrates that increasing batch size beyond 96 leads to diminishing returns in throughput gain, while latency remains relatively stable up to 20 ms. The threshold ε=0.1 suggests a performance floor, beyond which further batch size increases yield negligible gains. This implies that systems should target batch sizes near 96 to optimize throughput without excessive latency. The sharp decline in throughput gain after 100 batch size indicates potential inefficiencies or resource saturation at larger scales.