## Diagram: Policy Tuning with Monte Carlo Tree Search and Preference Learning
### Overview
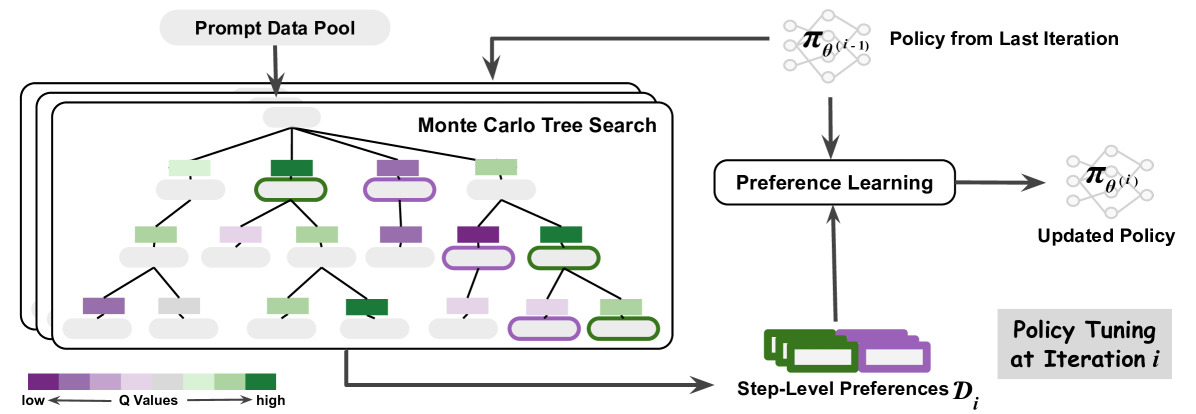
The image is a diagram illustrating a policy tuning process that incorporates Monte Carlo Tree Search (MCTS) and preference learning. The diagram shows how a prompt data pool is used to guide MCTS, which then informs preference learning to update a policy. Step-level preferences are also used in the preference learning process.
### Components/Axes
* **Prompt Data Pool:** Located at the top-left, this is the starting point of the process.
* **Monte Carlo Tree Search:** A tree structure in the center-left, with nodes colored according to Q-values.
* **Q Values Legend:** A horizontal color gradient at the bottom, indicating that purple represents low Q-values and green represents high Q-values.
* **Policy from Last Iteration:** Represented by a neural network-like diagram at the top-right, labeled as "π<sub>θ(i-1)</sub>".
* **Preference Learning:** A rounded rectangle in the center-right, indicating the preference learning process.
* **Updated Policy:** Represented by a neural network-like diagram at the right, labeled as "π<sub>θ(i)</sub>".
* **Step-Level Preferences:** A stack of rectangles at the bottom, labeled as "Step-Level Preferences D<sub>i</sub>".
* **Policy Tuning at Iteration i:** A label indicating the overall process.
### Detailed Analysis
* **Prompt Data Pool:** An arrow points from the "Prompt Data Pool" down into the "Monte Carlo Tree Search" structure.
* **Monte Carlo Tree Search:** The tree structure consists of nodes with varying Q-values, indicated by the color gradient from purple (low) to green (high). The nodes are arranged in a hierarchical tree structure. Some nodes have a thicker outline.
* **Policy from Last Iteration:** An arrow points from the "Policy from Last Iteration" down into the "Preference Learning" box.
* **Preference Learning:** The "Preference Learning" box receives input from both the "Monte Carlo Tree Search" and "Step-Level Preferences".
* **Updated Policy:** An arrow points from the "Preference Learning" box to the "Updated Policy".
* **Step-Level Preferences:** An arrow points from the "Step-Level Preferences" up into the "Preference Learning" box.
* **Q Values Legend:** The legend indicates a gradient from purple (low Q values) to green (high Q values). The arrow indicates the direction of increasing Q values.
### Key Observations
* The diagram illustrates an iterative process of policy tuning.
* Monte Carlo Tree Search is used to explore the search space, and the Q-values guide the preference learning process.
* Step-level preferences are incorporated into the preference learning process.
* The policy is updated based on the preference learning outcome.
### Interpretation
The diagram depicts a reinforcement learning approach where a policy is iteratively refined using Monte Carlo Tree Search and preference learning. The "Prompt Data Pool" provides initial data to guide the search. The MCTS explores different actions and their potential outcomes, and the Q-values associated with each node in the tree represent the estimated value of taking that action. The "Policy from Last Iteration" represents the current policy, which is used to guide the MCTS. The "Step-Level Preferences" provide additional information about the desired behavior at each step. The "Preference Learning" process combines the information from the MCTS, the previous policy, and the step-level preferences to update the policy. The "Updated Policy" then becomes the "Policy from Last Iteration" in the next iteration. The color gradient in the MCTS tree visually represents the Q-values, with green nodes indicating higher values and purple nodes indicating lower values. This suggests that the algorithm is exploring actions that lead to higher rewards or more desirable outcomes.