\n
## Diagram: Iterative Policy Refinement with Monte Carlo Tree Search and Preference Learning
### Overview
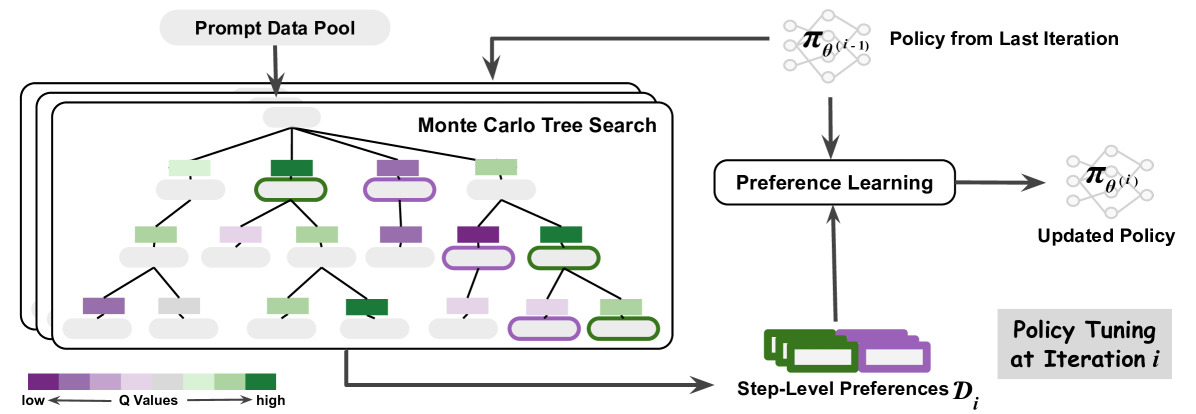
This diagram illustrates an iterative process for refining a policy using Monte Carlo Tree Search (MCTS) and Preference Learning. The process involves generating data through MCTS, learning from preferences, and updating the policy. The diagram shows the flow of data and policy updates between these components.
### Components/Axes
The diagram consists of the following components:
* **Prompt Data Pool:** The source of prompts for the MCTS.
* **Monte Carlo Tree Search (MCTS):** A search algorithm represented as a tree structure with nodes colored based on Q-values (low to high).
* **Policy from Last Iteration (π<sub>θ(i-1)</sub>):** The policy used in the previous iteration. Represented as a diamond-shaped node.
* **Preference Learning:** A process that learns from step-level preferences. Represented as a rectangular node.
* **Updated Policy (π<sub>θ(i)</sub>):** The refined policy after preference learning. Represented as a diamond-shaped node.
* **Step-Level Preferences (D<sub>i</sub>):** The preferences derived from the MCTS. Represented as a series of rectangular nodes.
* **Policy Tuning at Iteration i:** Indicates the iteration number.
* **Q Values Legend:** A color gradient indicating the range of Q-values from low (purple) to high (green).
### Detailed Analysis or Content Details
The diagram shows a cyclical flow of information:
1. **MCTS Input:** The Prompt Data Pool feeds into the Monte Carlo Tree Search.
2. **Policy Guidance:** The Policy from Last Iteration (π<sub>θ(i-1)</sub>) guides the MCTS.
3. **MCTS Output:** The MCTS generates Step-Level Preferences (D<sub>i</sub>). The nodes within the MCTS tree are colored based on their Q-values, ranging from purple (low) to green (high). There are approximately 20 nodes visible in the MCTS tree.
4. **Preference Learning Input:** The Step-Level Preferences (D<sub>i</sub>) are fed into the Preference Learning component.
5. **Policy Update:** The Preference Learning component outputs an Updated Policy (π<sub>θ(i)</sub>).
6. **Iteration:** The Updated Policy becomes the Policy from Last Iteration for the next iteration of the process.
The MCTS tree appears to be a branching structure, with nodes at different levels. The color of the nodes indicates the Q-value associated with that state or action. The diagram does not provide specific numerical values for the Q-values or policy parameters.
### Key Observations
* The diagram highlights an iterative process, where the policy is continuously refined based on feedback from the MCTS and preference learning.
* The Q-value gradient within the MCTS tree suggests that the algorithm is exploring different options and assigning values based on their estimated reward.
* The use of preference learning indicates that the system is learning from human or other forms of feedback to improve the policy.
### Interpretation
This diagram represents a reinforcement learning framework that combines the exploration capabilities of Monte Carlo Tree Search with the learning power of preference learning. The iterative nature of the process allows the policy to adapt and improve over time. The MCTS provides a way to generate data and explore the search space, while preference learning provides a mechanism for incorporating feedback and refining the policy. The Q-values within the MCTS tree represent the estimated value of different states or actions, guiding the search process. The diagram suggests a system designed to learn complex behaviors through interaction and feedback. The cyclical nature of the diagram emphasizes the continuous improvement loop inherent in reinforcement learning. The diagram does not provide specific details about the preference learning algorithm or the policy representation, but it clearly illustrates the overall architecture of the system.