## Line Graphs: E-prop vs Target Signal Matching
### Overview
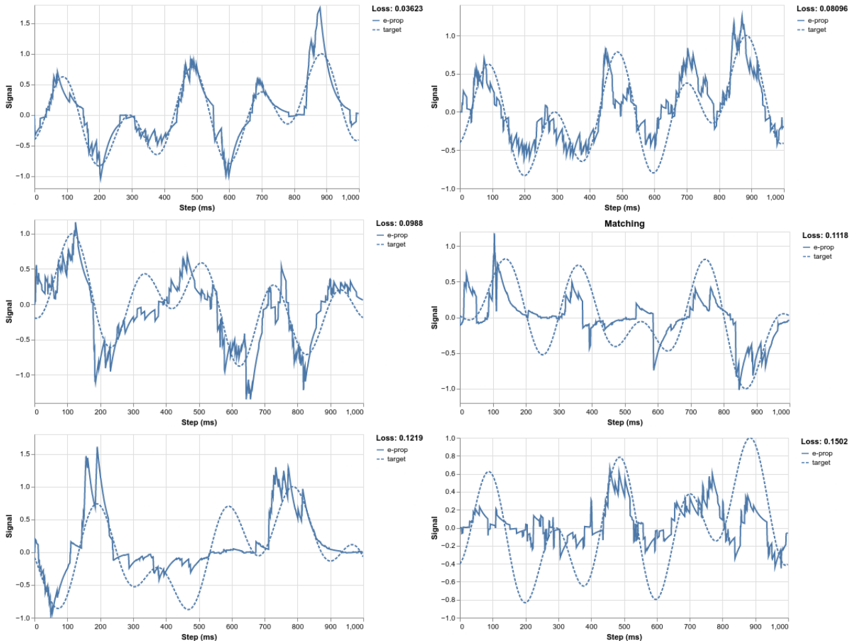
The image contains six line graphs arranged in a 2x3 grid. Each graph displays two data series: "e-prop" (a solid blue line) and "target" (a dashed blue line). The graphs illustrate how well the "e-prop" signal matches the "target" signal over a "Step (ms)" range from 0 to 1000. Each graph also includes a "Loss" value in the top-right corner, indicating the error between the two signals.
### Components/Axes
* **X-axis:** "Step (ms)" - Ranges from 0 to 1000 in increments of 100.
* **Y-axis:** "Signal" - Ranges from -1.0 to 1.0 (or higher in some plots) in increments of 0.5.
* **Legend:** Located in the top-right corner of each graph.
* "e-prop": Solid blue line
* "target": Dashed blue line
* **Title:** One of the graphs has the title "Matching".
* **Loss:** A numerical value displayed in the top-right corner of each graph, indicating the loss or error.
### Detailed Analysis
**Top-Left Graph:**
* Loss: 0.03623
* e-prop: The solid blue line starts around 0.25, oscillates with several peaks and valleys, and ends around 0.25.
* target: The dashed blue line is a smoother oscillation, generally following the trend of the e-prop line.
**Top-Right Graph:**
* Loss: 0.08096
* e-prop: The solid blue line starts around 0.25, oscillates with several peaks and valleys, and ends around 0.25.
* target: The dashed blue line is a smoother oscillation, generally following the trend of the e-prop line.
**Middle-Left Graph:**
* Loss: 0.0988
* e-prop: The solid blue line starts around 0.0, oscillates with several peaks and valleys, and ends around 0.0.
* target: The dashed blue line is a smoother oscillation, generally following the trend of the e-prop line.
**Middle-Right Graph:**
* Title: Matching
* Loss: 0.1118
* e-prop: The solid blue line starts around 0.25, oscillates with several peaks and valleys, and ends around 0.25.
* target: The dashed blue line is a smoother oscillation, generally following the trend of the e-prop line.
**Bottom-Left Graph:**
* Loss: 0.1219
* e-prop: The solid blue line starts around -0.5, oscillates with several peaks and valleys, and ends around 0.0.
* target: The dashed blue line is a smoother oscillation, generally following the trend of the e-prop line.
**Bottom-Right Graph:**
* Loss: 0.1502
* e-prop: The solid blue line starts around 0.25, oscillates with several peaks and valleys, and ends around 0.25.
* target: The dashed blue line is a smoother oscillation, generally following the trend of the e-prop line.
### Key Observations
* The "Loss" values vary across the graphs, indicating different levels of matching between the "e-prop" and "target" signals.
* The "e-prop" lines appear more jagged and noisy compared to the smoother "target" lines.
* The "e-prop" signal attempts to approximate the "target" signal, but the accuracy varies.
### Interpretation
The graphs illustrate the performance of an "e-prop" model in approximating a "target" signal. The "Loss" value quantifies the error between the two signals, with lower values indicating better matching. The visual comparison of the "e-prop" and "target" lines reveals the model's ability to capture the general trend of the target signal, although with some discrepancies. The differences in "Loss" values across the graphs suggest that the model's performance varies depending on the specific signal being approximated. The "Matching" title on one of the graphs suggests that the goal is to achieve a close match between the two signals.