# Technical Document Extraction: Action Distribution Histogram
## Title
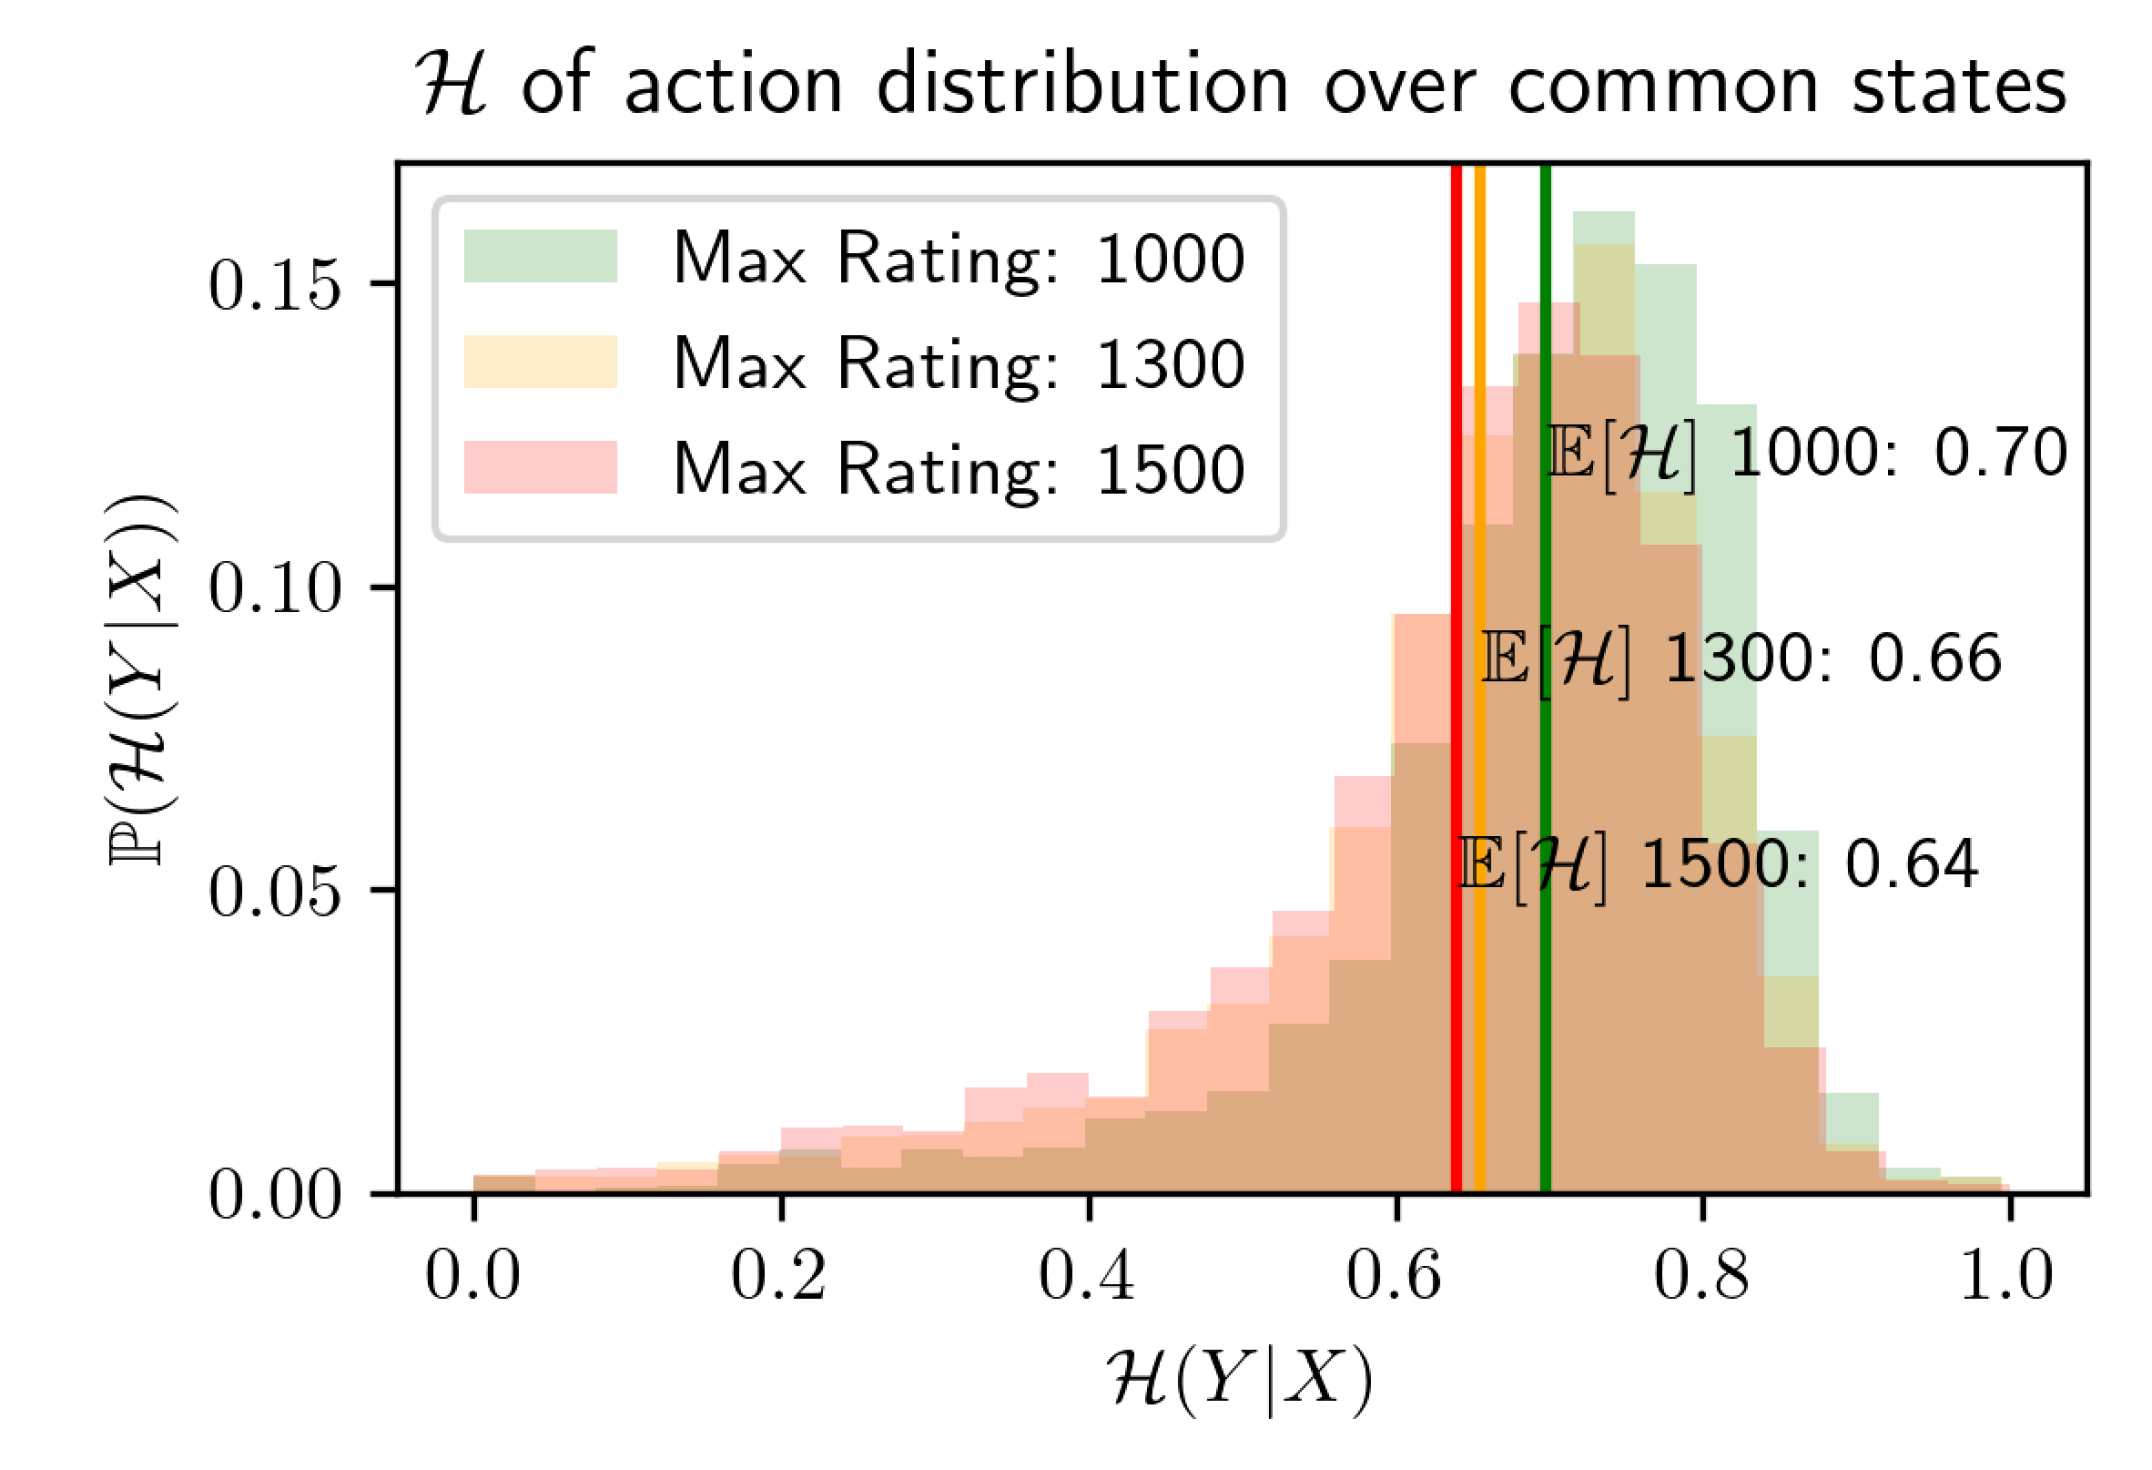
**H of action distribution over common states**
## Axes
- **X-axis**: ℋ(Y|X) (ranges from 0.0 to 1.0)
- **Y-axis**: P(ℋ(Y|X)) (ranges from 0.00 to 0.15)
## Legend
- **Location**: Top-left corner
- **Entries**:
- Green: Max Rating: 1000
- Orange: Max Rating: 1300
- Red: Max Rating: 1500
## Data Points & Trends
1. **Max Rating: 1000 (Green)**
- **E[ℋ]**: 0.70
- **Visual Trend**: Peaks sharply near x=0.70, with a tall, narrow distribution.
- **Key Observation**: Highest probability density (y-axis) among all distributions.
2. **Max Rating: 1300 (Orange)**
- **E[ℋ]**: 0.66
- **Visual Trend**: Broader distribution than 1000, peaking near x=0.66.
- **Key Observation**: Overlaps with 1000 but has a lower peak.
3. **Max Rating: 1500 (Red)**
- **E[ℋ]**: 0.64
- **Visual Trend**: Widest distribution, peaking near x=0.64.
- **Key Observation**: Lowest peak but extends further left/right.
## Chart Structure
- **Type**: Stacked histogram with overlapping distributions.
- **Color Coding**:
- Green (1000) dominates the rightmost region (x > 0.7).
- Orange (1300) occupies the middle region (x ≈ 0.6–0.7).
- Red (1500) spans the leftmost region (x < 0.65).
## Spatial Grounding
- **Legend Colors**:
- Green (1000) matches green bars.
- Orange (1300) matches orange bars.
- Red (1500) matches red bars.
- **Vertical Lines**:
- Red line at x=0.70 (1000).
- Orange line at x=0.66 (1300).
- Green line at x=0.64 (1500).
## Additional Text
- **Embedded Labels**:
- "E[ℋ] 1000: 0.70" (near red line).
- "E[ℋ] 1300: 0.66" (near orange line).
- "E[ℋ] 1500: 0.64" (near green line).
## Notes
- No non-English text detected.
- All numerical values and labels are explicitly transcribed.
- Trends and spatial relationships are cross-verified with legend and axis markers.