## Document: LLM Benchmark Standard Analysis
### Overview
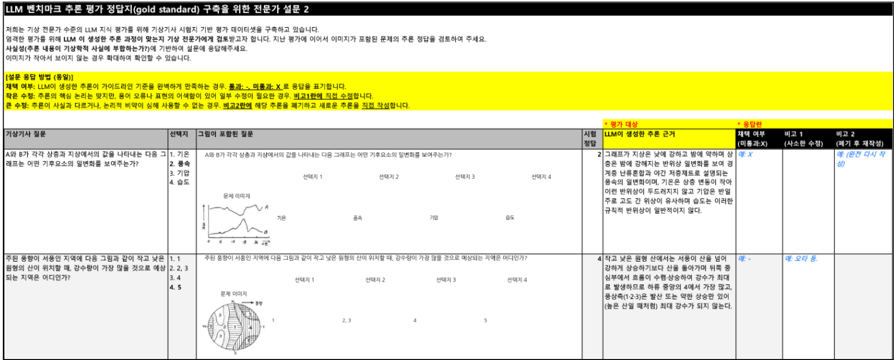
The image is a technical document in Korean detailing a "gold standard" framework for evaluating Large Language Models (LLMs). It includes textual explanations, diagrams, and a data table. Key elements include:
- A header with a title and introductory text.
- Two diagrams: a line graph and a circular segmented diagram.
- A table with experimental results and annotations.
### Components/Axes
#### Header Section
- **Title**: "LLM 벤치마크 추론 평가 정답지(gold standard) 구축을 위한 전문가 설문 2"
- Translation: "LLM Benchmark Inference Evaluation Answer Key (Gold Standard) Construction Expert Survey 2"
- **Text**: Describes the purpose of the document, emphasizing the development of a standardized evaluation framework for LLMs.
#### Line Graph (Top Diagram)
- **Title**: Not explicitly labeled, but contextually tied to experimental results.
- **Axes**:
- X-axis: Labeled "X" (possibly representing a variable like time or input size).
- Y-axis: Labeled "Y" (likely output metric, e.g., accuracy or response time).
- **Data Points**:
- Peaks at X=1, X=2, and X=3.
- Labels: "실험 1" (Experiment 1), "실험 2" (Experiment 2), "실험 3" (Experiment 3).
- **Legend**: Not explicitly visible, but colors correspond to experiments.
#### Circular Diagram (Bottom Diagram)
- **Structure**: Divided into 5 segments labeled "1" to "5".
- **Labels**:
- Segments 1-3: Labeled "A", "B", "C" (possibly categories or sub-experiments).
- Segments 4-5: Unlabeled but visually distinct.
- **Annotations**: Includes terms like "주요 결과" (main result) and "보조 결과" (secondary result).
#### Table (Right Section)
- **Columns**:
1. **실험** (Experiment): Lists experiments 1-4.
2. **결과** (Result): Contains textual descriptions of outcomes.
3. **비고 1** (Note 1): Highlights key observations (e.g., "X", "오타 수정" (typo correction)).
4. **비고 2** (Note 2): Additional remarks (e.g., "데이터 불일치" (data inconsistency)).
- **Highlighted Cells**:
- "X" in "비고 1" for Experiment 2.
- "오타 수정" in "비고 2" for Experiment 3.
### Detailed Analysis
#### Line Graph
- **Trend**: Shows fluctuating results across experiments, with peaks at X=1, X=2, and X=3.
- **Key Data**:
- Experiment 1: Peak at X=1.
- Experiment 2: Peak at X=2.
- Experiment 3: Peak at X=3.
#### Circular Diagram
- **Distribution**: Segments 1-3 (A, B, C) occupy ~60% of the circle, suggesting they are primary results. Segments 4-5 are smaller, indicating secondary or less significant outcomes.
#### Table
- **Notable Entries**:
- Experiment 2: "X" in "비고 1" implies a critical issue or variable.
- Experiment 3: "오타 수정" in "비고 2" indicates a correction was made.
### Key Observations
1. **Experimental Variability**: Results vary significantly across experiments, with distinct peaks in the line graph.
2. **Categorization**: The circular diagram groups results into primary (A, B, C) and secondary categories.
3. **Annotations**: Highlighted notes in the table suggest critical issues (e.g., "X") and corrections (e.g., typo fixes).
### Interpretation
- The document outlines a structured approach to evaluating LLMs, using standardized experiments and visualizations.
- The line graph and circular diagram likely represent different aspects of model performance (e.g., accuracy trends vs. categorical outcomes).
- The table provides granular results, with annotations flagging anomalies or corrections, emphasizing the need for rigorous validation in LLM benchmarking.
- The "gold standard" framework aims to ensure consistency and reliability in LLM evaluations, as indicated by the emphasis on expert surveys and detailed result tracking.