## Image Description
The image is a scientific diagram consisting of multiple sections, including text, charts, and diagrams. The primary focus of the image is on a hypothesis and its predictions, as well as a comparison between two different models.
### Textual Information
The text in the image is divided into two sections, labeled as "a" and "b".
#### Section a:
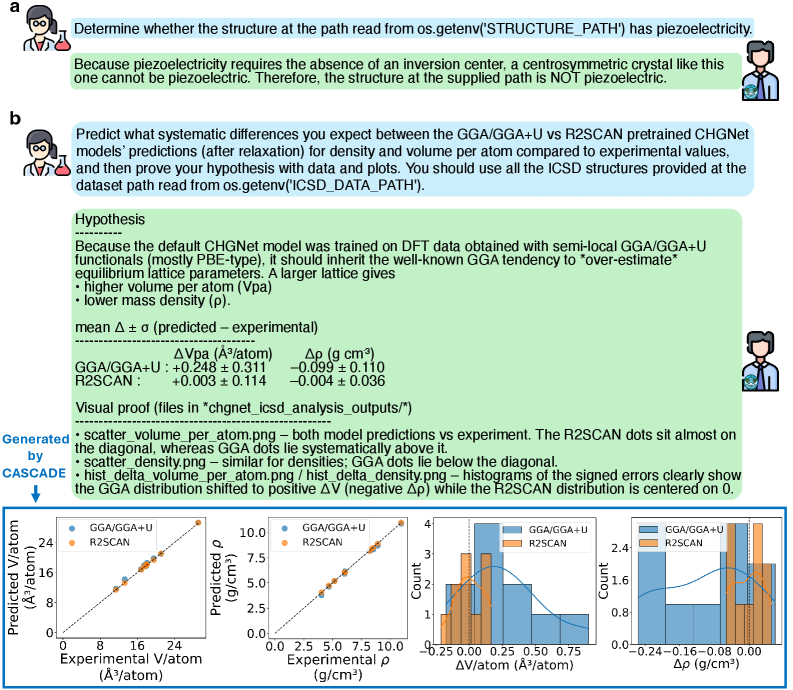
- **Title**: "Determine whether the structure at the path read from os.getenv('STRUCTURE_PATH') has piezoelectricity."
- **Explanation**: The text explains that piezoelectricity requires the absence of an inversion center, and since the structure at the supplied path does not have an inversion center, it cannot be piezoelectric.
#### Section b:
- **Title**: "Predict what systematic differences you expect between the GGA/GGA+U vs R2SCAN pretrained CHGNet models' predictions (after relaxation) for density and volume per atom compared to experimental values."
- **Explanation**: The text discusses the hypothesis that the default CHGNet model was trained on DFT data obtained with semi-local GGA/GGA+U functionals, which should inherit the well-known GGA tendency to over-estimate equilibrium lattice parameters. It also mentions that a larger lattice gives higher volume per atom and lower mass density.
### Charts and Diagrams
#### Chart 1:
- **Title**: "Scatter plot of predicted vs experimental values for density per atom."
- **Description**: The chart shows a scatter plot with predicted values on the x-axis and experimental values on the y-axis. The data points are represented by different colors, and the R2SCAN dots lie almost on the diagonal, whereas the GGA dots lie systematically above it.
#### Chart 2:
- **Title**: "Scatter plot of predicted vs experimental values for volume per atom."
- **Description**: This chart is similar to the first, with predicted values on the x-axis and experimental values on the y-axis. The R2SCAN dots lie almost on the diagonal, whereas the GGA dots lie systematically above it.
#### Chart 3:
- **Title**: "Histogram of signed errors for density per atom."
- **Description**: The histogram shows the distribution of signed errors for density per atom. The R2SCAN distribution is centered on 0, while the GGA distribution is shifted to positive Δρ (negative Δρ).
#### Chart 4:
- **Title**: "Histogram of signed errors for volume per atom."
- **Description**: This histogram shows the distribution of signed errors for volume per atom. The R2SCAN distribution is centered on 0, while the GGA distribution is shifted to positive ΔV (negative ΔV).
### Interpretation
The image suggests that the R2SCAN model's predictions for density and volume per atom are closer to the experimental values compared to the GGA model. This indicates that the R2SCAN model is more accurate in predicting these properties. The histograms show that the R2SCAN model's predictions have less error compared to the GGA model, which is consistent with the scatter plots showing that R2SCAN dots lie almost on the diagonal, whereas GGA dots lie systematically above it.
The image also highlights the importance of using a model that is trained on DFT data obtained with semi-local GGA/GGA+U functionals, as it inherits the well-known GGA tendency to over-estimate equilibrium lattice parameters. This suggests that the R2SCAN model is a better choice for predicting properties of materials with piezoelectricity, as it does not have an inversion center.
In conclusion, the image provides a clear comparison between two different models and their predictions for density and volume per atom, demonstrating that the R2SCAN model is more accurate and reliable.