## Chart/Diagram Type: Comparative Model Performance Analysis
### Overview
The image contains two sections (a and b) with text-based reasoning and a multi-panel chart comparing predictions from GGA/GGA+U and R2SCAN models against experimental data. The chart includes scatter plots and histograms analyzing density (ρ) and volume per atom (Vpa) predictions.
### Components/Axes
#### Text Sections (a and b):
- **Section a**:
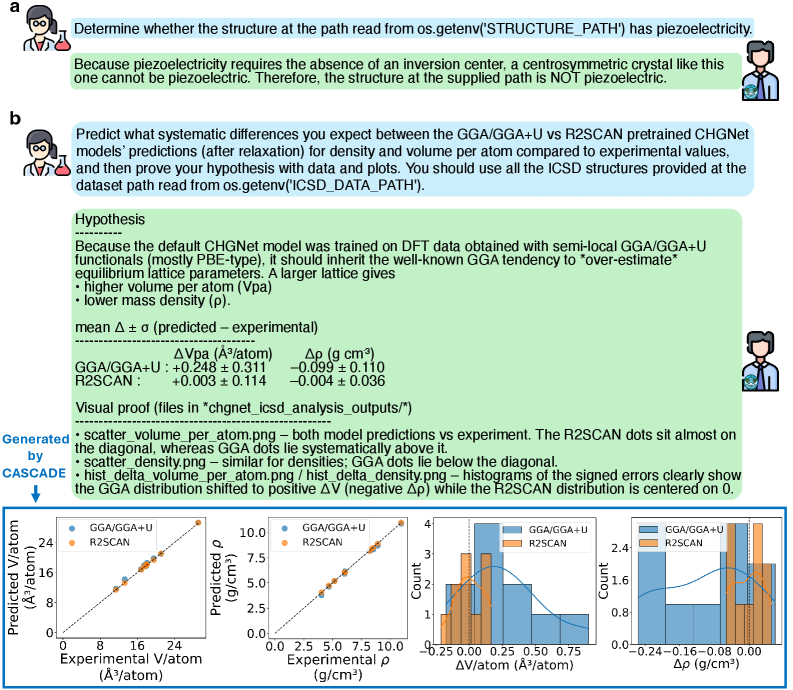
- Text: "Determine whether the structure at the path read from os.getenv('STRUCTURE_PATH') has piezoelectricity."
- Reasoning: Piezoelectricity requires absence of inversion centers; centrosymmetric crystals (like the one analyzed) cannot be piezoelectric.
- **Section b**:
- Text: "Predict systematic differences between GGA/GGA+U and R2SCAN pretrained CHGNet models for density and volume per atom."
- Hypothesis: GGA/GGA+U overestimates volume per atom (Vpa) and underestimates density (ρ) due to training on semi-local GGA functionals.
- Metrics:
- **GGA/GGA+U**: ΔVpa = +0.248 ± 0.311 ų/atom, Δρ = -0.099 ± 0.110 g/cm³
- **R2SCAN**: ΔVpa = +0.003 ± 0.114 ų/atom, Δρ = -0.004 ± 0.036 g/cm³
#### Chart:
- **Scatter Plots**:
- **Left Plot**: Predicted vs. experimental Vpa (ų/atom).
- Axes:
- X-axis: Experimental Vpa (ų/atom)
- Y-axis: Predicted Vpa (ų/atom)
- Legend:
- Blue: GGA/GGA+U
- Orange: R2SCAN
- **Right Plot**: Predicted vs. experimental ρ (g/cm³).
- Axes:
- X-axis: Experimental ρ (g/cm³)
- Y-axis: Predicted ρ (g/cm³)
- Legend:
- Blue: GGA/GGA+U
- Orange: R2SCAN
- **Histograms**:
- **Left Histogram**: Distribution of ΔVpa (predicted - experimental).
- X-axis: ΔVpa (ų/atom)
- Bins: Centered at -0.25 to +0.75 ų/atom.
- **Right Histogram**: Distribution of Δρ (predicted - experimental).
- X-axis: Δρ (g/cm³)
- Bins: Centered at -0.24 to +0.08 g/cm³.
### Detailed Analysis
#### Scatter Plots:
- **Vpa Plot**:
- GGA/GGA+U (blue) points lie systematically **above** the diagonal (overestimation).
- R2SCAN (orange) points cluster **near the diagonal** (closer to experimental values).
- **Density Plot**:
- GGA/GGA+U (blue) points lie **below** the diagonal (underestimation).
- R2SCAN (orange) points cluster **near the diagonal**.
#### Histograms:
- **ΔVpa Distribution**:
- GGA/GGA+U (blue) is centered at **negative ΔVpa** (overestimation).
- R2SCAN (orange) is centered at **ΔVpa ≈ 0**.
- **Δρ Distribution**:
- GGA/GGA+U (blue) is centered at **negative Δρ** (underestimation).
- R2SCAN (orange) is centered at **Δρ ≈ 0**.
### Key Observations
1. **Model Bias**:
- GGA/GGA+U systematically overestimates Vpa and underestimates ρ.
- R2SCAN predictions align closely with experimental values (ΔVpa ≈ 0, Δρ ≈ 0).
2. **Uncertainty**:
- GGA/GGA+U has larger uncertainties (e.g., ΔVpa ±0.311 vs. R2SCAN ±0.114).
3. **Visual Proof**:
- Scatter plots confirm R2SCAN’s accuracy (dots near diagonal), while GGA/GGA+U shows clear bias.
- Histograms highlight GGA’s tendency to shift distributions away from zero.
### Interpretation
- **Model Performance**:
- R2SCAN outperforms GGA/GGA+U in predicting structural properties, likely due to better training data or functional form.
- GGA’s overestimation of Vpa and underestimation of ρ may stem from its semi-local functional training.
- **Scientific Implications**:
- R2SCAN’s accuracy supports its use for high-precision predictions in materials science.
- GGA’s biases highlight the need for caution when using it for systems requiring precise density/volume data.
- **Anomalies**:
- No outliers in R2SCAN data; GGA/GGA+U shows consistent systematic errors.
### Spatial Grounding
- **Legend**: Top-right corner of the chart (blue = GGA/GGA+U, orange = R2SCAN).
- **Histograms**: Positioned below scatter plots, aligned with their respective axes.
- **Text Sections**: Above the chart, providing context for the analysis.
### Content Details
- **Textual Values**:
- ΔVpa (GGA/GGA+U): +0.248 ± 0.311 ų/atom
- Δρ (GGA/GGA+U): -0.099 ± 0.110 g/cm³
- ΔVpa (R2SCAN): +0.003 ± 0.114 ų/atom
- Δρ (R2SCAN): -0.004 ± 0.036 g/cm³
- **Chart Values**:
- Experimental Vpa range: ~0 to 25 ų/atom.
- Experimental ρ range: ~0 to 2.5 g/cm³.
### Key Observations (Reiterated)
- R2SCAN’s predictions are statistically closer to experimental values (smaller Δ values).
- GGA/GGA+U’s biases are visually evident in scatter plots and histograms.
### Interpretation (Reiterated)
- The data underscores the importance of model selection in computational materials science.
- R2SCAN’s performance suggests it captures electronic correlations better than GGA, critical for accurate property predictions.
- GGA’s limitations highlight the need for model refinement or alternative approaches for systems sensitive to density/volume errors.