## Chart Type: Scatter Plots
### Overview
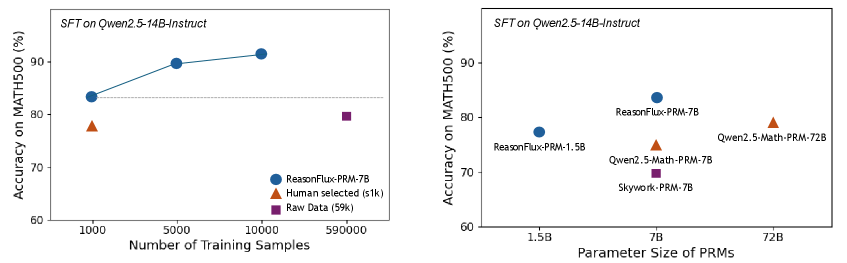
The image contains two scatter plots comparing the performance of different models on the MATH500 dataset. The left plot shows the accuracy of models trained with varying numbers of training samples, while the right plot shows the accuracy of models with different parameter sizes.
### Components/Axes
**Left Plot:**
* **Title:** SFT on Qwen2.5-14B-Instruct
* **Y-axis:** Accuracy on MATH500 (%), ranging from 60 to 90.
* **X-axis:** Number of Training Samples, with values 1000, 5000, 10000, and 590000.
* **Legend:** Located in the bottom-right corner.
* Blue circle: ReasonFlux-PRM-7B
* Orange triangle: Human selected (≤1k)
* Purple square: Raw Data (59k)
* A horizontal dashed line is present at approximately 83% accuracy.
**Right Plot:**
* **Title:** SFT on Qwen2.5-14B-Instruct
* **Y-axis:** Accuracy on MATH500 (%), ranging from 60 to 90.
* **X-axis:** Parameter Size of PRMs, with values 1.5B, 7B, and 72B.
* **Legend:** Implicit through data point labels.
* ReasonFlux-PRM-7B (Blue circle)
* Qwen2.5-Math-PRM-72B (Orange triangle)
* ReasonFlux-PRM-1.5B (Blue circle)
* Qwen2.5-Math-PRM-7B (Purple square)
* Skywork-PRM-7B (Purple square)
### Detailed Analysis
**Left Plot:**
* **ReasonFlux-PRM-7B (Blue circles):** The accuracy increases with the number of training samples.
* 1000 samples: Accuracy ≈ 83%
* 5000 samples: Accuracy ≈ 90%
* 10000 samples: Accuracy ≈ 92%
* **Human selected (≤1k) (Orange triangle):** Accuracy ≈ 78% at 1000 samples.
* **Raw Data (59k) (Purple square):** Accuracy ≈ 80% at 590000 samples.
**Right Plot:**
* **ReasonFlux-PRM-1.5B (Blue circle):** Accuracy ≈ 77% at 1.5B parameters.
* **ReasonFlux-PRM-7B (Blue circle):** Accuracy ≈ 82% at 7B parameters.
* **Qwen2.5-Math-PRM-72B (Orange triangle):** Accuracy ≈ 79% at 72B parameters.
* **Qwen2.5-Math-PRM-7B (Purple square):** Accuracy ≈ 70% at 7B parameters.
* **Skywork-PRM-7B (Purple square):** Accuracy ≈ 70% at 7B parameters.
### Key Observations
* In the left plot, the ReasonFlux-PRM-7B model shows a clear positive correlation between the number of training samples and accuracy.
* The "Human selected" data point in the left plot has a lower accuracy than the ReasonFlux-PRM-7B model trained with the same number of samples.
* In the right plot, there is no clear trend between parameter size and accuracy. Some models with smaller parameter sizes perform better than models with larger parameter sizes.
### Interpretation
The plots suggest that increasing the number of training samples can improve the accuracy of a model (ReasonFlux-PRM-7B). However, simply increasing the parameter size does not guarantee better performance. The choice of model architecture and training data selection also play a significant role in determining the final accuracy. The "Human selected" data point indicates that curated data selection can be beneficial, but in this case, it does not outperform the model trained with more data. The Raw Data point on the left plot shows that even with a very large number of samples, the accuracy may not be as high as with a smaller, well-trained dataset. The right plot highlights the importance of model architecture and training methodology, as models with similar parameter sizes can have significantly different accuracies.