## Charts: SFT on Qwen2.5-14B-Instruct Performance
### Overview
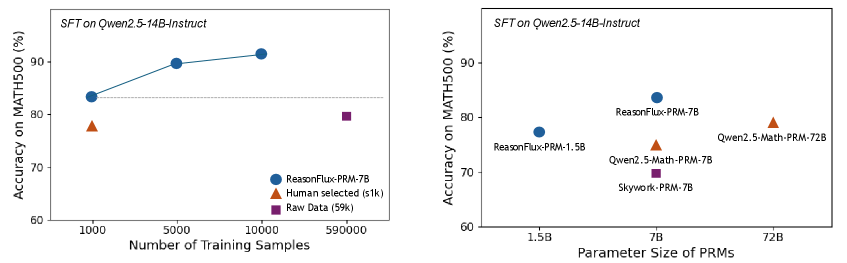
The image presents two line charts comparing the performance of different models on the MATH500 dataset. The first chart shows the impact of the number of training samples on accuracy, while the second chart shows the impact of parameter size on accuracy. Both charts use the same y-axis scale representing accuracy as a percentage.
### Components/Axes
**Chart 1: Number of Training Samples**
* **Title:** SFT on Qwen2.5-14B-Instruct
* **X-axis:** Number of Training Samples (labeled with values: 1000, 5000, 10000, 590000)
* **Y-axis:** Accuracy on MATH500 (%) (labeled with values: 60, 70, 80, 90)
* **Legend:**
* ReasonFlux-PRM-7B (Blue Circle)
* Human selected (≤1k) (Orange Triangle)
* Raw Data (59k) (Purple Square)
**Chart 2: Parameter Size of PRMs**
* **Title:** SFT on Qwen2.5-14B-Instruct
* **X-axis:** Parameter Size of PRMs (labeled with values: 1.5B, 7B, 72B)
* **Y-axis:** Accuracy on MATH500 (%) (labeled with values: 60, 70, 80, 90)
* **Legend:**
* ReasonFlux-PRM-7B (Blue Circle)
* Qwen2.5-Math-PRM-72B (Orange Triangle)
* Qwen2.5-Math-PRM-7B (Purple Square)
* Skywork-PRM-7B (Purple Square)
* ReasonFlux-PRM-1.5B (Gray Circle)
### Detailed Analysis or Content Details
**Chart 1: Number of Training Samples**
* **ReasonFlux-PRM-7B (Blue):** The line slopes upward, indicating increasing accuracy with more training samples.
* At 1000 samples: Approximately 84% accuracy.
* At 5000 samples: Approximately 89% accuracy.
* At 10000 samples: Approximately 92% accuracy.
* At 590000 samples: Approximately 92% accuracy.
* **Human selected (≤1k) (Orange):** A single data point at approximately 82% accuracy.
* **Raw Data (59k) (Purple):** A single data point at approximately 87% accuracy.
**Chart 2: Parameter Size of PRMs**
* **ReasonFlux-PRM-7B (Blue):** Approximately 85% accuracy.
* **Qwen2.5-Math-PRM-72B (Orange):** Approximately 81% accuracy.
* **Qwen2.5-Math-PRM-7B (Purple):** Approximately 73% accuracy.
* **Skywork-PRM-7B (Purple):** Approximately 70% accuracy.
* **ReasonFlux-PRM-1.5B (Gray):** Approximately 76% accuracy.
### Key Observations
* In the first chart, increasing the number of training samples generally improves accuracy for ReasonFlux-PRM-7B, but the improvement plateaus after 10,000 samples.
* In the second chart, ReasonFlux-PRM-7B achieves the highest accuracy among the models tested.
* The model Qwen2.5-Math-PRM-72B, despite having the largest parameter size, does not achieve the highest accuracy.
* Skywork-PRM-7B has the lowest accuracy.
### Interpretation
The data suggests that for the Qwen2.5-14B-Instruct model, the number of training samples is a significant factor in performance on the MATH500 dataset, up to a certain point. Beyond 10,000 samples, the gains in accuracy diminish. The second chart indicates that parameter size alone does not guarantee higher accuracy; model architecture and training data quality also play crucial roles. The superior performance of ReasonFlux-PRM-7B suggests that its architecture or training process is more effective than the other models tested, even with fewer parameters than Qwen2.5-Math-PRM-72B. The relatively low accuracy of Skywork-PRM-7B could indicate issues with its architecture, training data, or optimization process. The difference between the "Human selected" and "Raw Data" points in the first chart suggests that curated training data can improve performance, but the effect is less pronounced than increasing the overall amount of training data.