## Chart: Test Accuracy vs. Communication Round
### Overview
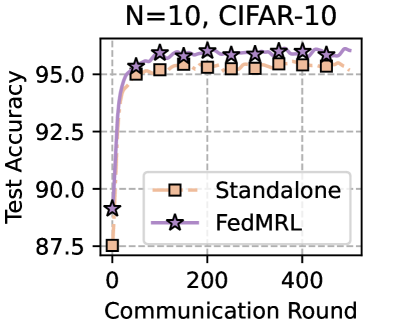
The image is a line chart comparing the test accuracy of two machine learning models, "Standalone" and "FedMRL," over a number of communication rounds. The chart is titled "N=10, CIFAR-10". The x-axis represents the communication round, and the y-axis represents the test accuracy.
### Components/Axes
* **Title:** N=10, CIFAR-10
* **X-axis:** Communication Round
* Scale: 0 to 500, with visible markers at 0, 200, and 400.
* **Y-axis:** Test Accuracy
* Scale: 87.5 to 95.0, with markers at 87.5, 90.0, 92.5, and 95.0.
* **Legend:** Located in the center-right of the chart.
* Standalone (peach dashed line with square markers)
* FedMRL (lavender solid line with star markers)
### Detailed Analysis
* **Standalone:**
* Trend: The peach dashed line starts at approximately 87.5% accuracy at round 0, quickly increases to approximately 95% by round 50, and then plateaus around 95.5% with slight fluctuations.
* Data Points:
* Round 0: ~87.5%
* Round 50: ~95%
* Round 200: ~95.5%
* Round 400: ~95.5%
* Round 500: ~95.5%
* **FedMRL:**
* Trend: The lavender solid line starts at approximately 89% accuracy at round 0, quickly increases to approximately 95% by round 50, and then plateaus around 96% with slight fluctuations.
* Data Points:
* Round 0: ~89%
* Round 50: ~95%
* Round 200: ~96%
* Round 400: ~96%
* Round 500: ~96%
### Key Observations
* Both models show a rapid increase in test accuracy in the initial communication rounds.
* FedMRL consistently outperforms Standalone, achieving a slightly higher test accuracy after the initial rounds.
* Both models plateau after approximately 50 communication rounds, with minimal improvement in accuracy.
### Interpretation
The chart demonstrates the performance of two machine learning models, Standalone and FedMRL, on the CIFAR-10 dataset with N=10. The FedMRL model exhibits a slightly better performance compared to the Standalone model, achieving a higher test accuracy. The rapid increase in accuracy during the initial communication rounds suggests that both models learn quickly. The plateauing of accuracy after a certain number of rounds indicates that further communication rounds do not significantly improve the model's performance. This could be due to the models reaching their maximum potential on the given dataset or the need for further optimization techniques.