\n
## Line Chart: Test Accuracy vs. Communication Round
### Overview
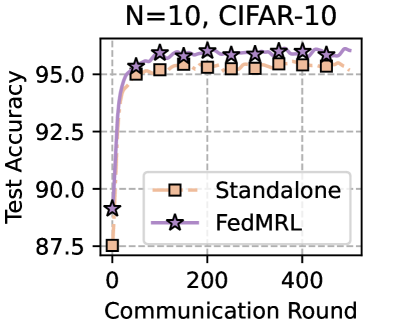
This line chart displays the test accuracy of two models, "Standalone" and "FedMRL", over a series of communication rounds. The chart is titled "N=10, CIFAR-10", indicating the experimental setup involves 10 participants and the CIFAR-10 dataset. A shaded gray region appears at the beginning of the chart, likely representing an initial training phase.
### Components/Axes
* **X-axis:** "Communication Round" - Scale ranges from 0 to 500, with markers at 0, 200, and 400.
* **Y-axis:** "Test Accuracy" - Scale ranges from 87.5 to 95.5, with markers at 87.5, 90.0, 92.5, 95.0, and 95.5.
* **Legend:** Located in the bottom-right corner.
* "Standalone" - Represented by an orange square with a dashed orange line.
* "FedMRL" - Represented by a purple star with a solid purple line.
* **Title:** "N=10, CIFAR-10" - Positioned at the top-center of the chart.
### Detailed Analysis
**Standalone (Orange Dashed Line):**
The line begins at approximately 87.75 (Communication Round = 0). It rapidly increases to approximately 95.25 (Communication Round = 50) and then plateaus, remaining relatively stable between 95.0 and 95.5 for the remainder of the communication rounds.
* Communication Round 0: ~87.75
* Communication Round 50: ~95.25
* Communication Round 100: ~95.25
* Communication Round 200: ~95.25
* Communication Round 300: ~95.25
* Communication Round 400: ~95.25
* Communication Round 500: ~95.25
**FedMRL (Purple Solid Line):**
The line starts at approximately 89.5 (Communication Round = 0). It exhibits a steep increase up to approximately 95.25 (Communication Round = 50), similar to the "Standalone" model. After this initial increase, it also plateaus, fluctuating slightly between 95.25 and 95.5 for the remaining communication rounds.
* Communication Round 0: ~89.5
* Communication Round 50: ~95.25
* Communication Round 100: ~95.5
* Communication Round 200: ~95.5
* Communication Round 300: ~95.5
* Communication Round 400: ~95.5
* Communication Round 500: ~95.5
### Key Observations
Both models achieve similar peak test accuracies (around 95.25-95.5). The "FedMRL" model demonstrates a slightly faster initial convergence, reaching a higher accuracy at earlier communication rounds compared to the "Standalone" model. After the initial convergence, both models maintain a stable level of accuracy. The shaded region at the beginning of the chart suggests a period of rapid learning or adaptation for both models.
### Interpretation
The chart demonstrates the performance of a "Standalone" model and a "FedMRL" model on the CIFAR-10 dataset with 10 participants. The rapid increase in test accuracy during the initial communication rounds indicates effective learning. The subsequent plateau suggests that the models have converged and further communication rounds do not significantly improve performance. The slight advantage of "FedMRL" in the initial stages suggests that the federated learning approach may offer faster convergence compared to the standalone training. The high final accuracy of both models indicates that both approaches are effective for this task. The fact that both lines converge to a similar accuracy suggests that the benefits of FedMRL are primarily in the initial learning phase, rather than achieving a fundamentally higher accuracy ceiling.