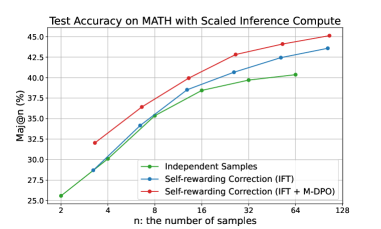
## Chart: Test Accuracy on MATH with Scaled Inference Compute
### Overview
The image is a line chart comparing the test accuracy of different methods on the MATH dataset as the number of samples increases. The chart plots "Maj@n (%)" on the y-axis against "n: the number of samples" on the x-axis. Three methods are compared: "Independent Samples", "Self-rewarding Correction (IFT)", and "Self-rewarding Correction (IFT + M-DPO)".
### Components/Axes
* **Title:** Test Accuracy on MATH with Scaled Inference Compute
* **X-axis:**
* Label: n: the number of samples
* Scale: 2, 4, 8, 16, 32, 64, 128
* **Y-axis:**
* Label: Maj@n (%)
* Scale: 25.0, 27.5, 30.0, 32.5, 35.0, 37.5, 40.0, 42.5, 45.0
* **Legend:** Located in the bottom-center of the chart.
* Green: Independent Samples
* Blue: Self-rewarding Correction (IFT)
* Red: Self-rewarding Correction (IFT + M-DPO)
### Detailed Analysis
* **Independent Samples (Green):**
* Trend: The line slopes upward, indicating increasing accuracy with more samples.
* Data Points:
* 2 samples: ~25.5%
* 4 samples: ~30.0%
* 8 samples: ~35.0%
* 16 samples: ~38.5%
* 32 samples: ~39.5%
* 64 samples: ~40.3%
* 128 samples: ~40.5%
* **Self-rewarding Correction (IFT) (Blue):**
* Trend: The line slopes upward, indicating increasing accuracy with more samples.
* Data Points:
* 2 samples: ~25.5%
* 4 samples: ~29.0%
* 8 samples: ~35.0%
* 16 samples: ~40.0%
* 32 samples: ~42.5%
* 64 samples: ~43.0%
* 128 samples: ~43.7%
* **Self-rewarding Correction (IFT + M-DPO) (Red):**
* Trend: The line slopes upward, indicating increasing accuracy with more samples.
* Data Points:
* 2 samples: ~32.0%
* 4 samples: ~34.0%
* 8 samples: ~39.0%
* 16 samples: ~41.5%
* 32 samples: ~43.5%
* 64 samples: ~44.0%
* 128 samples: ~45.0%
### Key Observations
* All three methods show an increase in test accuracy as the number of samples increases.
* The "Self-rewarding Correction (IFT + M-DPO)" method (red line) consistently outperforms the other two methods across all sample sizes.
* The "Self-rewarding Correction (IFT)" method (blue line) generally performs better than the "Independent Samples" method (green line).
* The performance gap between the methods appears to narrow as the number of samples increases, especially between "Self-rewarding Correction (IFT)" and "Self-rewarding Correction (IFT + M-DPO)".
### Interpretation
The chart demonstrates the impact of different inference techniques on the accuracy of solving math problems, as measured by the "Maj@n" metric. The "Self-rewarding Correction (IFT + M-DPO)" method appears to be the most effective, suggesting that combining self-rewarding correction with M-DPO leads to better performance. The increasing accuracy with more samples indicates that these methods benefit from increased computational resources. The narrowing performance gap at higher sample sizes might suggest diminishing returns or a convergence in the capabilities of the different methods as they approach their performance limits on the MATH dataset.