## Heatmap: Cellular Automaton Evolution
### Overview
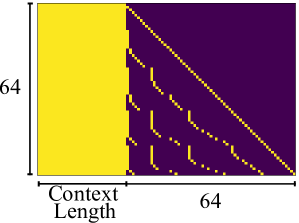
The image is a heatmap visualizing the evolution of a cellular automaton over 64 time steps, starting from an initial context of length 64. The heatmap displays the state of each cell at each time step, with yellow representing one state and dark purple representing another. The initial context is entirely in the yellow state.
### Components/Axes
* **X-axis:** Represents the spatial dimension of the cellular automaton, with a length of 64 cells. Labeled "Context Length".
* **Y-axis:** Represents the time steps of the evolution, ranging from 0 to 64.
* **Color Scale:**
* Yellow: Represents one state of the cell (e.g., "on" or "1").
* Dark Purple: Represents the other state of the cell (e.g., "off" or "0").
### Detailed Analysis
The heatmap shows the evolution of the cellular automaton from an initial state where all cells in the context are in the yellow state. As time progresses (moving down the heatmap), the cells change state according to the rules of the automaton.
* **Initial State:** The first 64 time steps are all yellow.
* **Evolution Pattern:** After the initial state, a pattern emerges where diagonal lines of yellow cells propagate from the top-right corner downwards. There are also vertical segments of yellow cells that appear and disappear.
* **Diagonal Lines:** The diagonal lines suggest a propagation of information or state change across the cells.
* **Vertical Segments:** The vertical segments indicate that some cells maintain their state for multiple time steps before changing.
### Key Observations
* The initial state has a significant impact on the subsequent evolution of the automaton.
* The evolution pattern is complex and non-uniform, with both diagonal and vertical structures.
* The automaton exhibits a degree of self-organization, as evidenced by the emergence of distinct patterns.
### Interpretation
The heatmap visualizes the dynamics of a cellular automaton, demonstrating how a simple set of rules can lead to complex and emergent behavior. The initial context plays a crucial role in shaping the evolution of the system. The diagonal lines and vertical segments in the heatmap suggest that the automaton exhibits both local and global interactions between cells. The specific patterns observed depend on the rules governing the automaton and the initial conditions. The image provides a visual representation of how complex systems can arise from simple components and interactions.