## Heatmap Diagram: Context Length vs. Dimension (64x64 Matrix)
### Overview
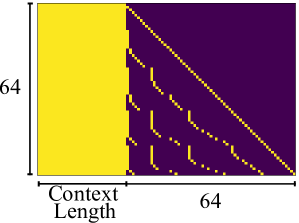
The image is a square heatmap or matrix visualization, likely representing an attention pattern, correlation matrix, or data distribution within a 64x64 grid. It uses a two-color scheme (yellow and dark purple) to represent binary or high/low values. The visualization is divided into two distinct regions by a vertical boundary.
### Components/Axes
* **X-Axis (Horizontal):** Labeled **"Context Length"**. A single numerical marker **"64"** is placed at the far right end of the axis, indicating the maximum value or dimension.
* **Y-Axis (Vertical):** A single numerical marker **"64"** is placed at the top-left corner, indicating the maximum value or dimension for the vertical axis. There is no explicit axis title.
* **Legend:** No separate legend is present. The color coding is intrinsic to the diagram:
* **Yellow:** Represents a value of 1, "active," "present," or high magnitude.
* **Dark Purple:** Represents a value of 0, "inactive," "absent," or low/negligible magnitude.
* **Spatial Layout:** The diagram is a perfect square. A sharp vertical line divides it into a left rectangular region (approximately the first 32 columns) and a right square region (the remaining columns up to 64).
### Detailed Analysis
The matrix can be segmented into two primary components based on the vertical dividing line:
1. **Left Region (Solid Yellow Block):**
* **Position:** Occupies the left portion of the matrix, from column 1 to approximately column 32 (the exact split point is not labeled but is visually halfway).
* **Content:** This entire rectangular area is filled with solid yellow. This indicates a constant, high value (e.g., 1) for all rows within this range of the "Context Length" axis.
2. **Right Region (Purple with Yellow Diagonal Pattern):**
* **Position:** Occupies the right portion of the matrix, from the vertical dividing line to column 64.
* **Background:** The base color is dark purple, indicating a value of 0 or near-zero for most cells in this region.
* **Data Pattern:** A distinct pattern of yellow dots is superimposed on the purple background.
* **Primary Diagonal:** A clear, continuous line of yellow dots runs from the top-left corner of this right region (at the dividing line, row 1) down to the bottom-right corner of the entire matrix (row 64, column 64). This represents a perfect diagonal where `row index = column index` (within the context of the full 64x64 matrix).
* **Sub-Diagonals:** Several parallel, shorter diagonal lines of yellow dots are visible below the main diagonal. These are offset to the left, forming a stepped or "staircase" pattern. They appear to be spaced at regular intervals (e.g., every 8 or 16 rows/columns), suggesting a block-diagonal or sparse attention pattern.
### Key Observations
* **Binary Representation:** The visualization uses a strict binary color scheme with no gradient, implying a clear on/off or present/absent state for each cell.
* **Sharp Boundary:** The transition from the solid yellow block to the purple region is abrupt, indicating a fundamental change in the data's behavior at a specific context length threshold.
* **Perfect Diagonal:** The main diagonal is flawlessly straight and continuous, indicating a perfect one-to-one relationship or self-association along the entire axis in the right region.
* **Structured Sparsity:** The pattern in the right region is not random; it shows a highly structured, sparse distribution of non-zero (yellow) values concentrated along specific diagonals.
### Interpretation
This diagram most likely visualizes a **causal attention mask** or a **position-based encoding pattern** from a transformer model or similar sequence processing architecture.
* **Left Solid Block:** This represents a **full attention** or **unmasked** region. For the first ~32 positions (context length), every token can attend to every other token within that window, resulting in a fully connected (yellow) sub-matrix.
* **Right Diagonal Pattern:** This represents a **causal** or **autoregressive** mask. For context lengths beyond the initial window, a token at position `i` can only attend to itself and previous tokens (`j <= i`). This creates the main diagonal (self-attention) and the lower sub-diagonals (attention to recent past tokens). The specific stepped pattern suggests a **local attention** or **dilated attention** mechanism, where tokens attend to a fixed number of previous positions or to positions in a strided pattern, rather than all previous positions.
* **Overall Meaning:** The image demonstrates a hybrid attention strategy. It combines a window of full, bidirectional attention at the beginning of a sequence with a constrained, causal, and locally sparse attention pattern for longer contexts. This is a common technique to balance model expressivity with computational efficiency, allowing the model to capture complex dependencies in short contexts while scaling to longer sequences. The precise threshold (at ~32) and the stride of the sub-diagonals are key architectural hyperparameters revealed by this visualization.