## Precision-Recall Curves: Evaluation of Factual Consistency Metrics
### Overview
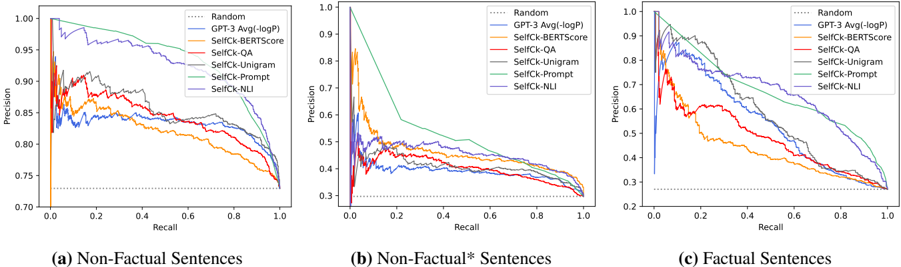
The image displays three precision-recall curves, each evaluating the performance of different metrics for detecting factual inconsistencies in text. The plots compare a "Random" baseline, a "GPT-3 Avg(-logP)" method, and several "SelfCk" (Self-Check) variants across three distinct data categories: (a) Non-Factual Sentences, (b) Non-Factual* Sentences, and (c) Factual Sentences. The curves illustrate the trade-off between precision (y-axis) and recall (x-axis) for each method.
### Components/Axes
* **Plot Structure:** Three horizontally arranged subplots, labeled (a), (b), and (c) at the bottom.
* **X-Axis (All Plots):** Labeled "Recall". Scale ranges from 0.0 to 1.0, with major tick marks at 0.0, 0.2, 0.4, 0.6, 0.8, and 1.0.
* **Y-Axis (All Plots):** Labeled "Precision". Scale ranges from 0.0 to 1.0, with major tick marks at 0.0, 0.2, 0.4, 0.6, 0.8, and 1.0.
* **Legend (Top-Right of each plot):** Contains 7 entries, each with a distinct line color and style:
1. `Random` - Dotted gray line.
2. `GPT-3 Avg(-logP)` - Solid blue line.
3. `SelfCk-BERTScore` - Solid orange line.
4. `SelfCk-QA` - Solid red line.
5. `SelfCk-Unigram` - Solid purple line.
6. `SelfCk-Prompt` - Solid green line.
7. `SelfCk-NLI` - Solid brown line.
* **Subplot Titles (Bottom Labels):**
* (a) Non-Factual Sentences
* (b) Non-Factual* Sentences
* (c) Factual Sentences
### Detailed Analysis
**Plot (a): Non-Factual Sentences**
* **Trend Verification:** Most methods show a classic precision-recall trade-off, with precision decreasing as recall increases. The `SelfCk-Prompt` (green) and `SelfCk-NLI` (brown) lines maintain the highest precision across most recall levels. The `Random` baseline is a flat line at approximately 0.73 precision.
* **Data Points (Approximate):**
* At Recall ~0.1: `SelfCk-Prompt` Precision ~0.98; `GPT-3` Precision ~0.85.
* At Recall ~0.5: `SelfCk-Prompt` Precision ~0.90; `SelfCk-NLI` Precision ~0.88; `GPT-3` Precision ~0.82.
* At Recall ~0.9: `SelfCk-Prompt` Precision ~0.80; `SelfCk-NLI` Precision ~0.78; `GPT-3` Precision ~0.76.
* All curves converge near Precision ~0.73 at Recall 1.0.
**Plot (b): Non-Factual* Sentences**
* **Trend Verification:** This plot shows significantly lower overall precision for all methods compared to plot (a). The `SelfCk-Prompt` (green) line starts very high but drops steeply. The `Random` baseline is a flat line at approximately 0.33 precision.
* **Data Points (Approximate):**
* At Recall ~0.1: `SelfCk-Prompt` Precision ~0.95; `SelfCk-NLI` Precision ~0.50; `GPT-3` Precision ~0.45.
* At Recall ~0.5: `SelfCk-Prompt` Precision ~0.45; `SelfCk-NLI` Precision ~0.40; `GPT-3` Precision ~0.38.
* At Recall ~0.9: All methods are clustered between Precision 0.30 and 0.35.
* All curves converge near Precision ~0.33 at Recall 1.0.
**Plot (c): Factual Sentences**
* **Trend Verification:** Performance is intermediate between plots (a) and (b). The `SelfCk-Prompt` (green) and `SelfCk-NLI` (brown) lines again demonstrate superior performance. The `Random` baseline is a flat line at approximately 0.25 precision.
* **Data Points (Approximate):**
* At Recall ~0.1: `SelfCk-Prompt` Precision ~0.95; `SelfCk-NLI` Precision ~0.90; `GPT-3` Precision ~0.80.
* At Recall ~0.5: `SelfCk-Prompt` Precision ~0.75; `SelfCk-NLI` Precision ~0.70; `GPT-3` Precision ~0.60.
* At Recall ~0.9: `SelfCk-Prompt` Precision ~0.50; `SelfCk-NLI` Precision ~0.45; `GPT-3` Precision ~0.40.
* All curves converge near Precision ~0.25 at Recall 1.0.
### Key Observations
1. **Consistent Hierarchy:** Across all three data categories, the `SelfCk-Prompt` (green) and `SelfCk-NLI` (brown) methods consistently achieve the highest precision for a given recall level. The `GPT-3 Avg(-logP)` (blue) method generally performs in the middle of the pack.
2. **Task Difficulty:** The baseline precision (the `Random` line) varies dramatically: ~0.73 for Non-Factual, ~0.33 for Non-Factual*, and ~0.25 for Factual sentences. This indicates the inherent difficulty of the detection task increases from (a) to (b) to (c), likely due to the subtlety of the inconsistencies or the nature of the factual sentences.
3. **Performance Degradation:** All methods show a more severe drop in precision as recall increases in the more difficult tasks (plots b and c) compared to plot (a).
4. **Curve Shape:** The `SelfCk-Prompt` curve in plot (b) exhibits a particularly steep initial drop, suggesting it identifies the most obvious inconsistencies with high precision but struggles as it attempts to achieve higher recall on this challenging subset.
### Interpretation
This data suggests that for the task of detecting factual inconsistencies, **prompt-based and Natural Language Inference (NLI) based self-check methods (`SelfCk-Prompt`, `SelfCk-NLI`) are significantly more reliable** than lexical (Unigram), embedding-based (BERTScore), or question-answering (QA) based approaches. They maintain a better balance of precision and recall.
The stark difference in baseline performance (`Random` line) between the three plots is a critical finding. It implies that the "Non-Factual*" category (plot b) and the "Factual Sentences" category (plot c) represent much harder discrimination tasks. The "Non-Factual*" category likely contains inconsistencies that are more nuanced or context-dependent than those in the standard "Non-Factual" set. The low baseline for "Factual Sentences" indicates that correctly identifying a sentence as factual (i.e., not flagging it as inconsistent) is inherently difficult, as many methods have a high false-positive rate (low precision) when trying to achieve high recall.
From a Peircean perspective, the signs (the precision-recall curves) indicate that the **meaning of "factual consistency" is best captured by models that perform deep semantic and logical inference** (Prompt, NLI) rather than surface-level matching. The investigation reveals that the problem is not monolithic; the nature of the text (non-factual vs. factual) and the subtlety of the error (*) fundamentally change the performance landscape of detection metrics. This underscores the importance of evaluating such metrics on diverse and challenging benchmarks.