## Diagram: State Transition Diagram with Rewards and Penalties
### Overview
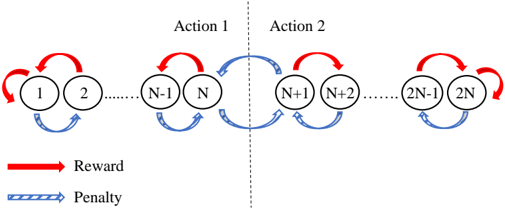
The image is a state transition diagram illustrating a system with 2N states, divided into two actions. Transitions between states are associated with either a reward (red arrow) or a penalty (blue arrow). The diagram shows the states, the possible transitions between them, and the associated rewards or penalties.
### Components/Axes
* **States:** Represented by circles labeled 1, 2, ..., N-1, N, N+1, N+2, ..., 2N-1, 2N.
* **Actions:** The states are divided into two groups, labeled "Action 1" and "Action 2" at the top of the diagram. Action 1 includes states 1 through N, and Action 2 includes states N+1 through 2N.
* **Transitions:** Represented by curved arrows between states.
* **Rewards:** Represented by red curved arrows.
* **Penalties:** Represented by blue curved arrows.
* **Legend:** Located at the bottom-left of the diagram.
* Red arrow: "Reward"
* Blue arrow: "Penalty"
* **Separator:** A vertical dashed line separates Action 1 and Action 2.
### Detailed Analysis
* **States 1 to N (Action 1):**
* Each state *i* (where *i* ranges from 1 to N) has a red arrow looping back to itself, indicating a reward for staying in the same state.
* Each state *i* has a red arrow going to the next state *i+1*.
* Each state *i+1* has a blue arrow going back to state *i*, indicating a penalty for transitioning back.
* **States N+1 to 2N (Action 2):**
* Each state *i* (where *i* ranges from N+1 to 2N) has a red arrow looping back to itself, indicating a reward for staying in the same state.
* Each state *i* has a red arrow going to the next state *i+1*.
* Each state *i+1* has a blue arrow going back to state *i*, indicating a penalty for transitioning back.
* **Transition between Action 1 and Action 2:**
* State N has a blue arrow going to state N+1, indicating a penalty for transitioning from Action 1 to Action 2.
* State N+1 has a blue arrow going to state N, indicating a penalty for transitioning from Action 2 to Action 1.
### Key Observations
* The diagram illustrates a system where staying in the same state yields a reward.
* Transitions to the next state within the same action yield a reward, while transitioning back incurs a penalty.
* Transitions between Action 1 and Action 2 incur a penalty.
* The diagram suggests a cyclical or sequential nature to the state transitions within each action.
### Interpretation
The diagram represents a system where an agent can choose between two actions, each consisting of a sequence of states. The agent is rewarded for staying in the same state or progressing to the next state within the same action. However, the agent is penalized for moving backward within an action or switching between actions. This could represent a scenario where maintaining a consistent course of action is beneficial, while frequent changes or reversals are detrimental. The penalties for switching actions suggest that there may be a cost associated with changing strategies or contexts. The diagram could be used to model various systems, such as decision-making processes, resource allocation, or even physical systems with constraints on movement.