TECHNICAL ASSET FINGERPRINT
81d0ed201696bb0ba0e73a1d
Click to view fullscreen
Press ESC or click to close
FOUND IN PAPERS
EXPERT: healer-alpha-free VERSION 1
RUNTIME: free/openrouter/healer-alpha
INTEL_VERIFIED
## Heatmap Comparison: Decision Boundaries of Logical Functions
### Overview
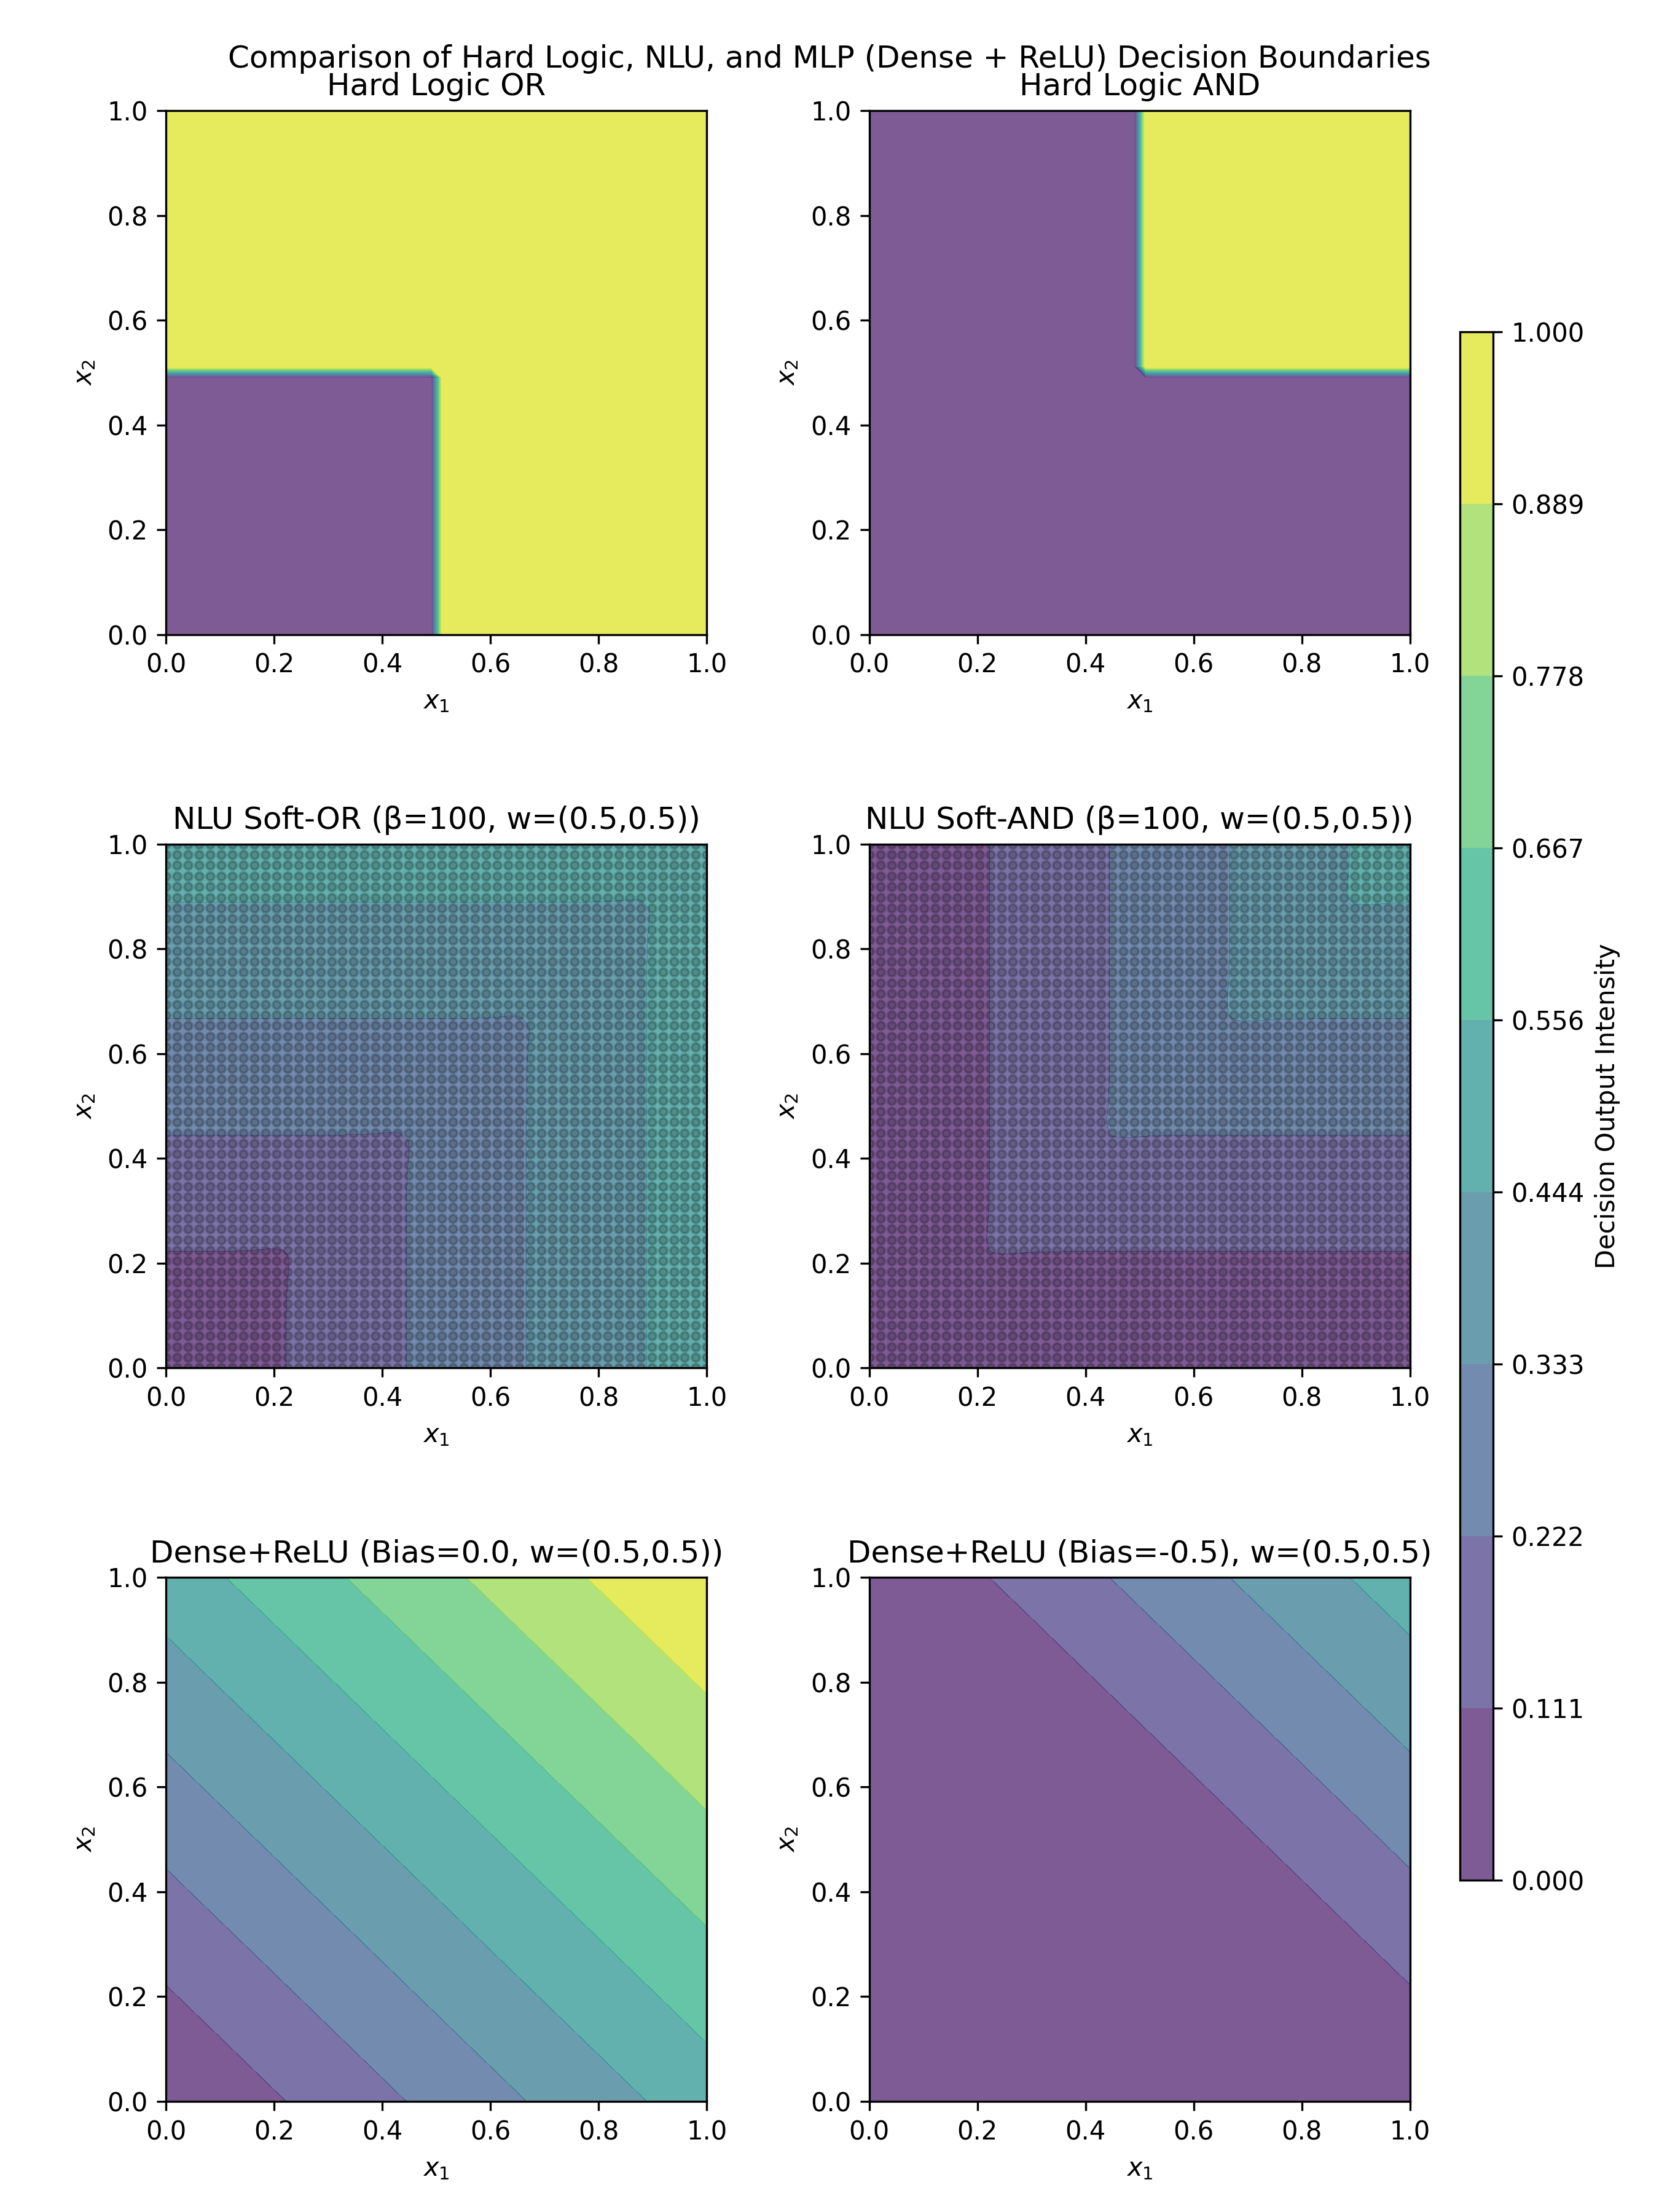
The image is a composite figure containing six subplots arranged in a 3x2 grid. It visually compares the decision boundaries and output intensities of three different computational models—Hard Logic, a Neural Logic Unit (NLU), and a simple Dense layer with ReLU activation—for implementing the logical OR and AND functions. A shared color bar on the right indicates the "Decision Output Intensity" from 0.000 (dark purple) to 1.000 (bright yellow).
### Components/Axes
* **Main Title:** "Comparison of Hard Logic, NLU, and MLP (Dense + ReLU) Decision Boundaries"
* **Subplot Titles (in reading order, left-to-right, top-to-bottom):**
1. "Hard Logic OR"
2. "Hard Logic AND"
3. "NLU Soft-OR (β=100, w=(0.5,0.5))"
4. "NLU Soft-AND (β=100, w=(0.5,0.5))"
5. "Dense+ReLU (Bias=0.0, w=(0.5,0.5))"
6. "Dense+ReLU (Bias=-0.5, w=(0.5,0.5))"
* **Axes:** All six subplots share identical axes.
* **X-axis:** Labeled `x₁`. Scale ranges from 0.0 to 1.0 with tick marks at 0.0, 0.2, 0.4, 0.6, 0.8, 1.0.
* **Y-axis:** Labeled `x₂`. Scale ranges from 0.0 to 1.0 with tick marks at 0.0, 0.2, 0.4, 0.6, 0.8, 1.0.
* **Color Bar (Right side):**
* **Label:** "Decision Output Intensity"
* **Scale:** Continuous gradient from 0.000 to 1.000.
* **Discrete Tick Values:** 0.000, 0.111, 0.222, 0.333, 0.444, 0.556, 0.667, 0.778, 0.889, 1.000.
### Detailed Analysis
**1. Hard Logic OR (Top-Left):**
* **Trend/Pattern:** Exhibits a sharp, step-function boundary. The output is 0.0 (purple) in the bottom-left quadrant and 1.0 (yellow) everywhere else.
* **Boundary:** The decision boundary is an L-shape formed by the lines `x₁ = 0.5` (for `x₂ < 0.5`) and `x₂ = 0.5` (for `x₁ < 0.5`). The output is 1.0 if `x₁ >= 0.5` OR `x₂ >= 0.5`.
**2. Hard Logic AND (Top-Right):**
* **Trend/Pattern:** Also a sharp step-function. The output is 1.0 (yellow) only in the top-right quadrant and 0.0 (purple) everywhere else.
* **Boundary:** The decision boundary is an L-shape formed by the lines `x₁ = 0.5` (for `x₂ >= 0.5`) and `x₂ = 0.5` (for `x₁ >= 0.5`). The output is 1.0 only if `x₁ >= 0.5` AND `x₂ >= 0.5`.
**3. NLU Soft-OR (Middle-Left):**
* **Trend/Pattern:** Shows a smooth, non-linear gradient. Output intensity increases as either `x₁` or `x₂` (or both) increase. The lowest values (dark purple) are at the origin (0,0), and the highest (yellow-green) are along the top and right edges.
* **Boundary:** No sharp boundary. The transition from low to high output is gradual, approximating the OR function softly. The parameters are β=100 (likely a steepness parameter) and weights w=(0.5, 0.5).
**4. NLU Soft-AND (Middle-Right):**
* **Trend/Pattern:** Shows a smooth, non-linear gradient. Output intensity increases only when both `x₁` and `x₂` are high. The lowest values (purple) cover most of the plot, with higher values (teal/green) concentrated in the top-right corner.
* **Boundary:** No sharp boundary. The transition is gradual, approximating the AND function softly. Uses the same parameters (β=100, w=(0.5,0.5)) as the Soft-OR.
**5. Dense+ReLU, Bias=0.0 (Bottom-Left):**
* **Trend/Pattern:** Displays a linear gradient with diagonal contour lines. Output intensity increases linearly from the bottom-left corner (0,0) to the top-right corner (1,1).
* **Boundary:** The decision boundary (where output crosses zero before ReLU) is the line `0.5*x₁ + 0.5*x₂ + 0.0 = 0`, which simplifies to `x₁ + x₂ = 0`. This line passes through the origin. The ReLU activation creates the visible linear ramp in the positive quadrant.
**6. Dense+ReLU, Bias=-0.5 (Bottom-Right):**
* **Trend/Pattern:** Similar linear gradient to the previous plot, but shifted. A large triangular region in the bottom-left (where `0.5*x₁ + 0.5*x₂ - 0.5 <= 0`) has an output of 0.0 (purple). The output increases linearly in the remaining top-right triangular region.
* **Boundary:** The decision boundary is the line `0.5*x₁ + 0.5*x₂ - 0.5 = 0`, or `x₁ + x₂ = 1.0`. This line runs diagonally from (0,1) to (1,0). The negative bias (-0.5) shifts the active region.
### Key Observations
1. **Discrete vs. Continuous:** Hard Logic produces binary, crisp decision boundaries. Both NLU and Dense+ReLU produce continuous, graded outputs.
2. **Shape of Boundaries:** The Hard Logic boundaries are axis-aligned (vertical/horizontal). The NLU boundaries are smooth and curved. The Dense+ReLU boundaries are linear and diagonal.
3. **Effect of Bias:** In the Dense+ReLU model, changing the bias from 0.0 to -0.5 dramatically shifts the decision boundary from `x₁ + x₂ = 0` to `x₁ + x₂ = 1`, altering the region of non-zero output.
4. **Function Approximation:** The NLU with high β (100) creates a steep but smooth transition, closely mimicking the hard logic functions. The Dense+ReLU with a single neuron can only create a linear decision boundary, which is a poor approximation for the non-linear OR/AND functions.
### Interpretation
This figure serves as a pedagogical comparison of how different computational models represent logical operations. It demonstrates the fundamental difference between symbolic (hard logic) and sub-symbolic (neural network) approaches.
* **Hard Logic** represents the ideal, mathematical definition of OR and AND with perfect precision but no tolerance for uncertainty or partial truth.
* **The NLU** acts as a "soft" logic gate. Its parameters (β, w) allow it to approximate the hard logic functions smoothly, which can be useful in differentiable computing contexts where gradients are needed for learning. The high β value makes it a very close approximation.
* **The Dense+ReLU neuron** represents the simplest neural network unit. Its linear decision boundary reveals its inherent limitation: a single neuron cannot model non-linearly separable functions like AND or OR perfectly. The bias term controls the threshold of activation but does not change the linear nature of the boundary.
The visualization argues that while simple neural units (Dense+ReLU) are limited, more specialized neuro-symbolic components like the NLU can effectively bridge the gap between crisp logical rules and smooth, learnable representations. The choice of model involves a trade-off between interpretability (hard logic), differentiability (NLU), and simplicity (Dense+ReLU).
DECODING INTELLIGENCE...