## Heatmap Grid: Comparison of Hard Logic, NLU, and MLP Decision Boundaries
### Overview
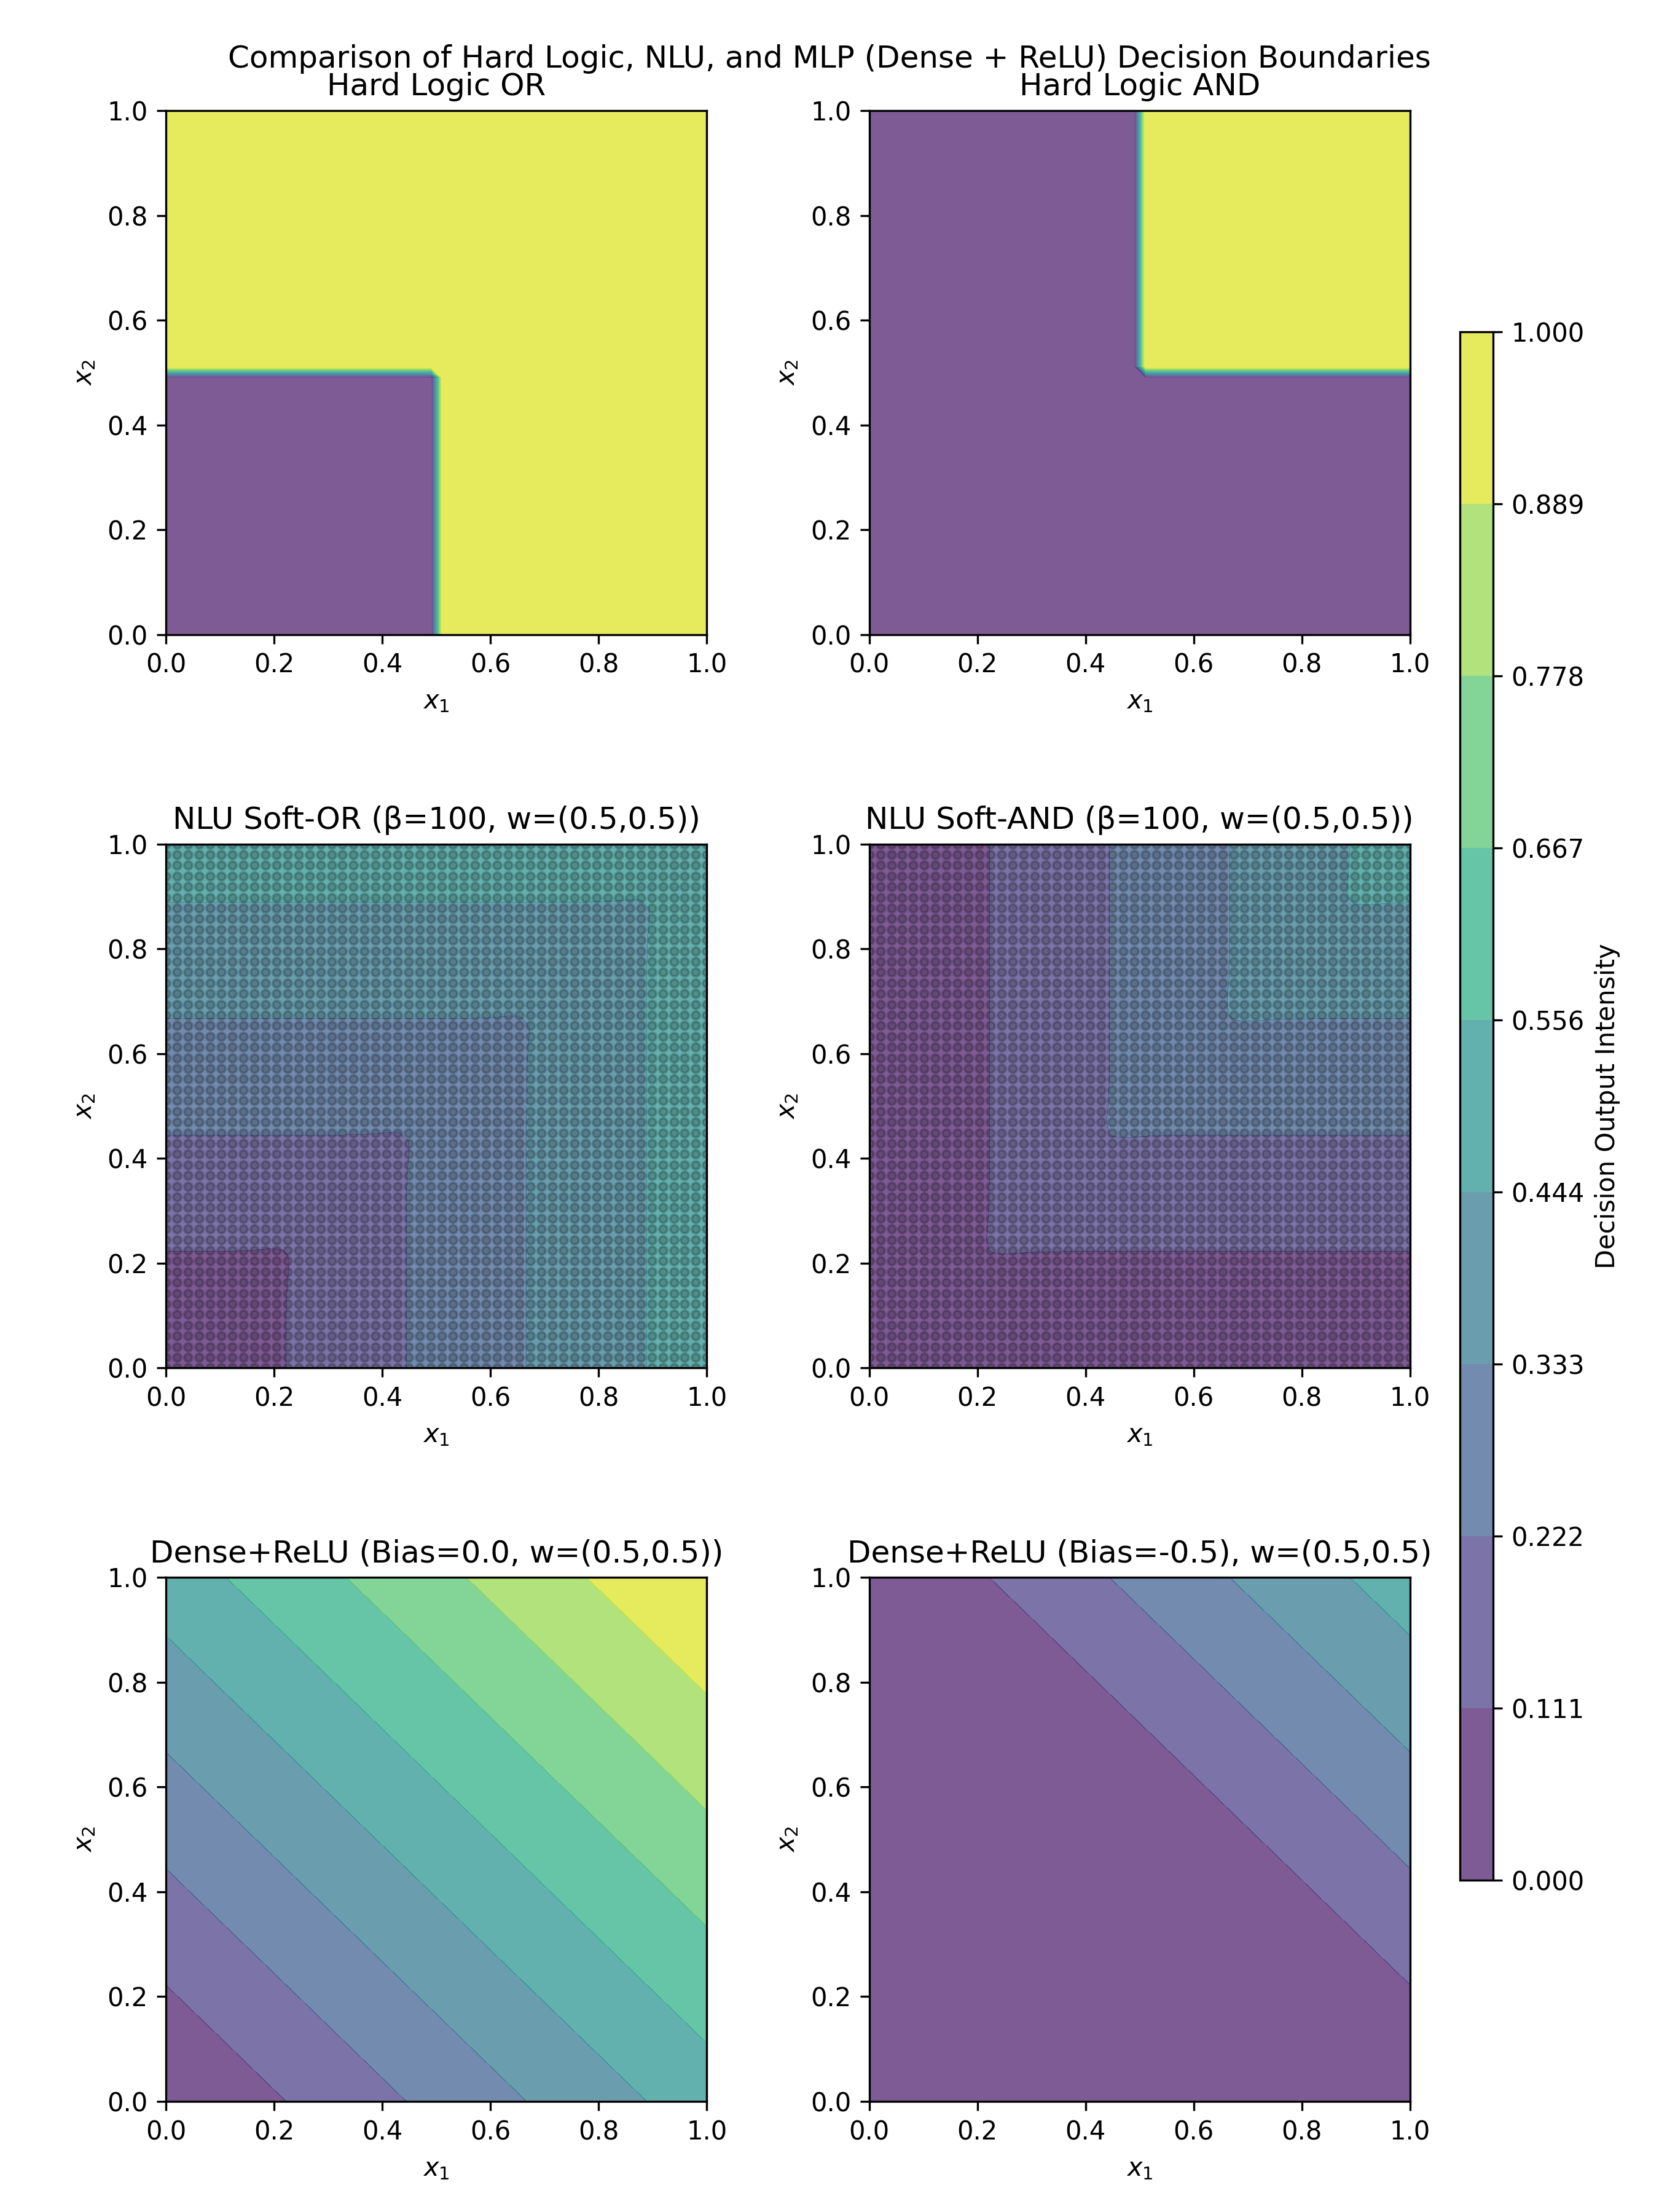
A 2x3 grid of heatmaps comparing decision boundaries for:
1. Hard Logic gates (OR, AND)
2. NLU soft gates (Soft-OR, Soft-AND)
3. Dense+ReLU neural networks with different biases
Each heatmap uses x1 (0-1) and x2 (0-1) axes with color-coded decision intensity.
### Components/Axes
- **X-axis (x1)**: 0.0 to 1.0 in 0.2 increments
- **Y-axis (x2)**: 0.0 to 1.0 in 0.2 increments
- **Color scales**:
- Rightmost colorbar: 0.000 to 1.000 (decision intensity)
- Individual heatmap scales vary (see Detailed Analysis)
- **Legend**: Positioned right of all heatmaps, showing gradient from purple (low) to yellow (high)
### Detailed Analysis
1. **Hard Logic OR** (Top-left)
- Binary output: Purple (0) below diagonal, yellow (1) above
- Sharp transition at x1=0.5, x2=0.5
- Scale: 0-1 (binary)
2. **Hard Logic AND** (Top-right)
- Binary output: Purple (0) except top-right quadrant
- Yellow square at x1>0.5, x2>0.5
- Scale: 0-1 (binary)
3. **NLU Soft-OR** (Middle-left)
- Gradual transition from purple to yellow
- Beta=100 creates near-binary behavior
- Scale: 0.222-0.889
4. **NLU Soft-AND** (Middle-right)
- Complex boundary with multiple transition zones
- Beta=100 creates sharp but non-binary outputs
- Scale: 0.000-0.667
5. **Dense+ReLU (Bias=0.0)** (Bottom-left)
- Diagonal gradient from purple to yellow
- w=(0.5,0.5) creates linear decision boundary
- Scale: 0.000-1.000
6. **Dense+ReLU (Bias=-0.5)** (Bottom-right)
- Uniform purple output across all inputs
- w=(0.5,0.5) with negative bias suppresses activation
- Scale: 0.000-0.111
### Key Observations
1. **Binary vs Continuous Outputs**:
- Hard Logic gates show perfect binary separation
- NLU models introduce soft transitions
- ReLU networks demonstrate bias-dependent activation
2. **Boundary Complexity**:
- OR/AND gates have simple geometric boundaries
- Soft-OR/Soft-AND show more complex decision surfaces
- ReLU networks exhibit linear/non-linear separability
3. **Bias Impact**:
- Positive bias (0.0) enables full activation range
- Negative bias (-0.5) severely limits output variation
### Interpretation
This visualization demonstrates:
1. **Model Complexity Tradeoffs**:
- Hard Logic provides perfect separation but lacks nuance
- NLU models balance binary decisions with probabilistic outputs
- ReLU networks show how parameter choices affect decision boundaries
2. **Activation Function Behavior**:
- ReLU's bias parameter critically influences output distribution
- Negative bias can effectively "disable" certain regions of input space
3. **Practical Implications**:
- For strict binary classification, Hard Logic gates are optimal
- For probabilistic reasoning, NLU soft gates offer better generalization
- ReLU networks require careful parameter tuning for effective decision boundaries
The data suggests that model selection should consider both the nature of the decision boundary required and the tradeoff between binary certainty and probabilistic reasoning capabilities.