\n
## Scatter Plot: Correlation between Generation and Multiple Choice Scores
### Overview
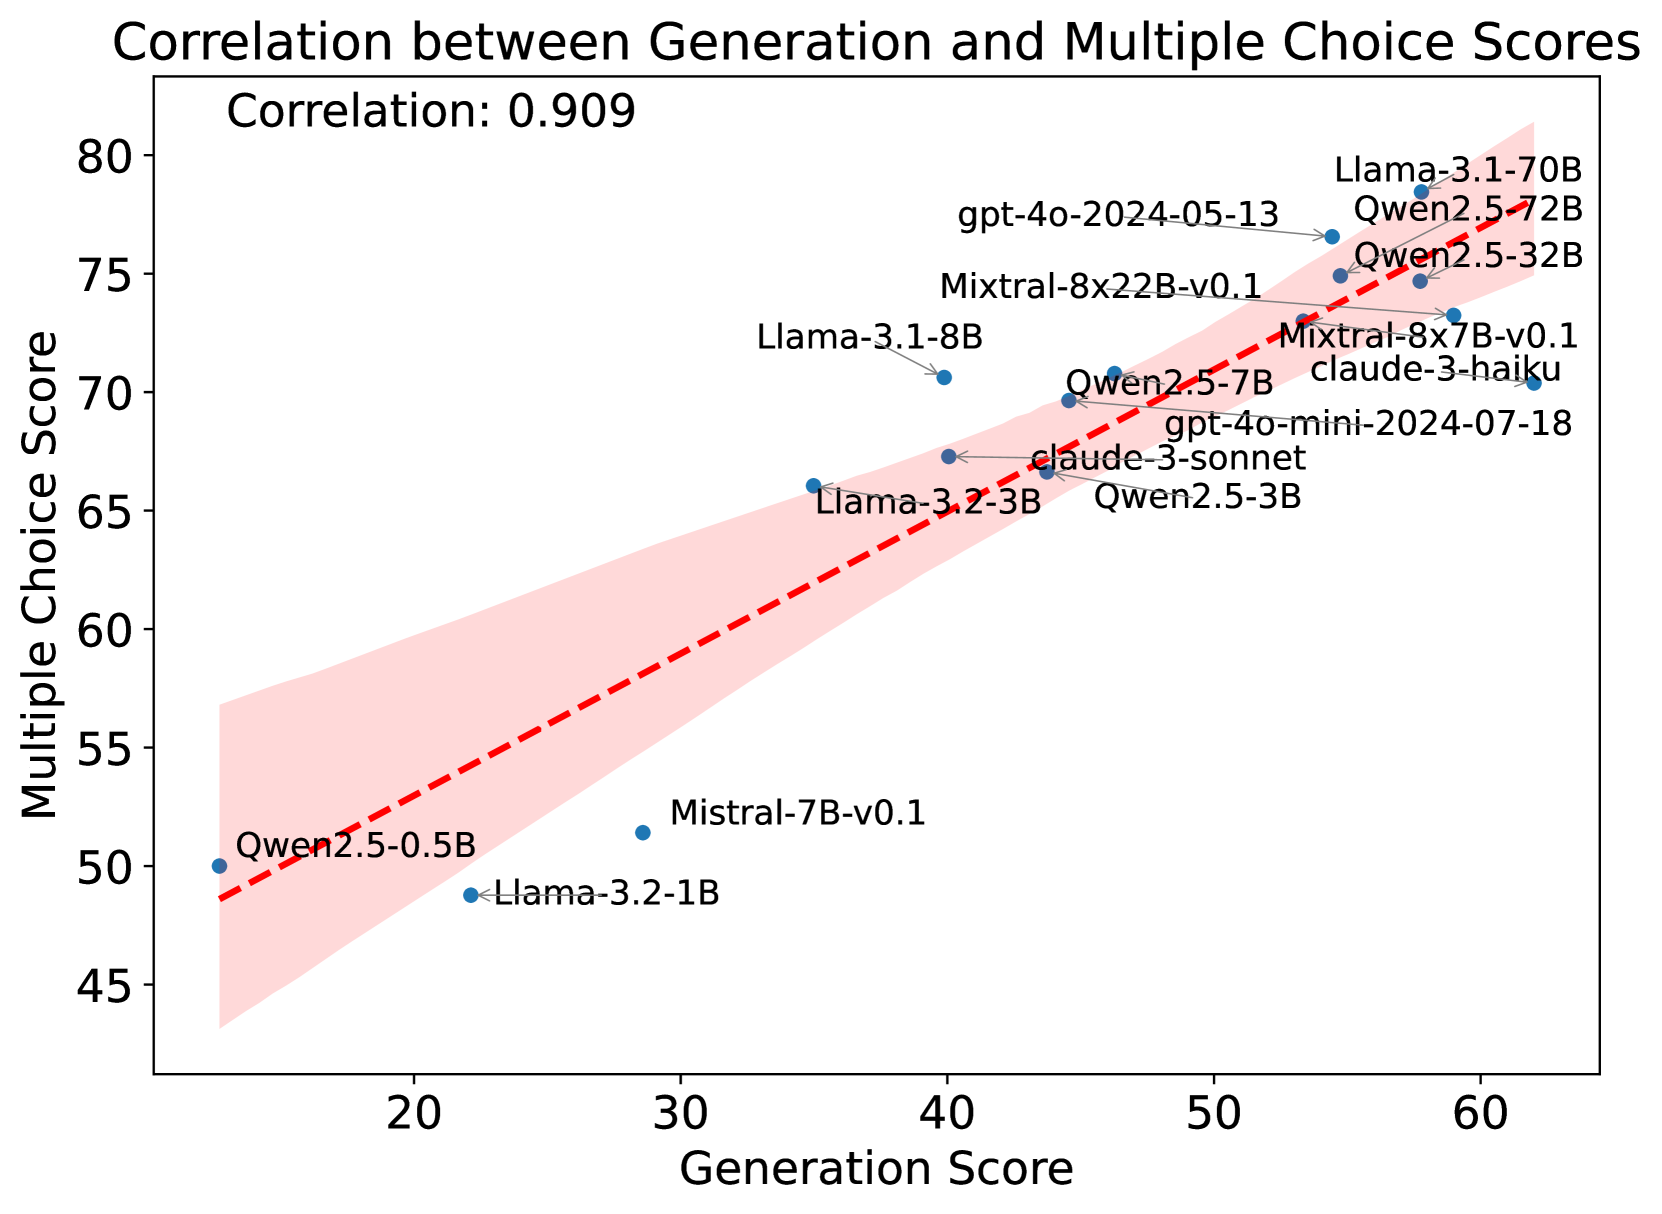
This image presents a scatter plot illustrating the correlation between "Generation Score" and "Multiple Choice Score" for various language models. A trend line is fitted to the data points, and the correlation coefficient is provided. The plot aims to demonstrate the relationship between a model's performance on a generation task and its ability to answer multiple-choice questions.
### Components/Axes
* **Title:** "Correlation between Generation and Multiple Choice Scores" (Top-center)
* **Correlation Coefficient:** 0.909 (Top-center, below the title)
* **X-axis:** "Generation Score" (Bottom-center), ranging from approximately 10 to 60.
* **Y-axis:** "Multiple Choice Score" (Left-center), ranging from approximately 40 to 80.
* **Data Points:** Represent individual language models, labeled with their names.
* **Trend Line:** A dashed red line representing the overall trend in the data.
* **Confidence Interval:** A shaded region around the trend line, indicating the uncertainty in the trend.
* **Legend:** Located in the top-right corner, listing the language models.
### Detailed Analysis
The trend line slopes upwards, indicating a positive correlation between Generation Score and Multiple Choice Score. The data points generally cluster around the trend line, suggesting a strong relationship.
Here's a breakdown of the data points, approximate values, and their corresponding labels:
* **Owen2.5-0.5B:** (Generation Score ≈ 17, Multiple Choice Score ≈ 52) - Bottom-left
* **Llama-3.2-1B:** (Generation Score ≈ 24, Multiple Choice Score ≈ 50) - Bottom-center
* **Mistral-7B-v0.1:** (Generation Score ≈ 30, Multiple Choice Score ≈ 54) - Bottom-center
* **Llama-3.1-8B:** (Generation Score ≈ 33, Multiple Choice Score ≈ 64) - Center-left
* **Llama-3.2-3B:** (Generation Score ≈ 36, Multiple Choice Score ≈ 65) - Center
* **gpt-4o-mini-2024-07-18:** (Generation Score ≈ 42, Multiple Choice Score ≈ 70) - Center-right
* **claude-3-sonnet:** (Generation Score ≈ 43, Multiple Choice Score ≈ 68) - Center-right
* **Owen2.5-3B:** (Generation Score ≈ 44, Multiple Choice Score ≈ 69) - Center-right
* **Owen2.5-7B:** (Generation Score ≈ 46, Multiple Choice Score ≈ 70) - Right-center
* **gpt-4o-2024-05-13:** (Generation Score ≈ 48, Multiple Choice Score ≈ 76) - Top-right
* **Mixtral-8x22B-v0.1:** (Generation Score ≈ 49, Multiple Choice Score ≈ 75) - Top-right
* **Mixtral-8x7B-v0.1:** (Generation Score ≈ 51, Multiple Choice Score ≈ 75) - Top-right
* **claude-3-haiku:** (Generation Score ≈ 52, Multiple Choice Score ≈ 74) - Top-right
* **Owen2.5-32B:** (Generation Score ≈ 53, Multiple Choice Score ≈ 75) - Top-right
* **Owen2.72B:** (Generation Score ≈ 55, Multiple Choice Score ≈ 76) - Top-right
* **Llama-3.1-70B:** (Generation Score ≈ 58, Multiple Choice Score ≈ 77) - Top-right
### Key Observations
* The correlation coefficient of 0.909 indicates a very strong positive correlation.
* The data points are relatively tightly clustered around the trend line, suggesting a consistent relationship.
* The models with lower Generation Scores also tend to have lower Multiple Choice Scores, and vice versa.
* There are no significant outliers that deviate substantially from the overall trend.
### Interpretation
The data strongly suggests that there is a positive correlation between a language model's performance on generation tasks (as measured by "Generation Score") and its ability to perform well on multiple-choice question answering (as measured by "Multiple Choice Score"). This implies that models that are better at generating coherent and relevant text are also more likely to be able to understand and reason about information to answer questions correctly.
The high correlation coefficient (0.909) indicates that the Generation Score is a good predictor of the Multiple Choice Score, and vice versa. This could be useful for evaluating and comparing different language models. The confidence interval around the trend line provides a measure of the uncertainty in this relationship.
The consistent clustering of data points around the trend line suggests that this relationship is robust and not driven by a few outliers. The absence of significant outliers further supports this conclusion. The models listed represent a diverse set of architectures and sizes, suggesting the correlation holds across different model types.