\n
## Scatter Plot: Correlation between Generation and Multiple Choice Scores
### Overview
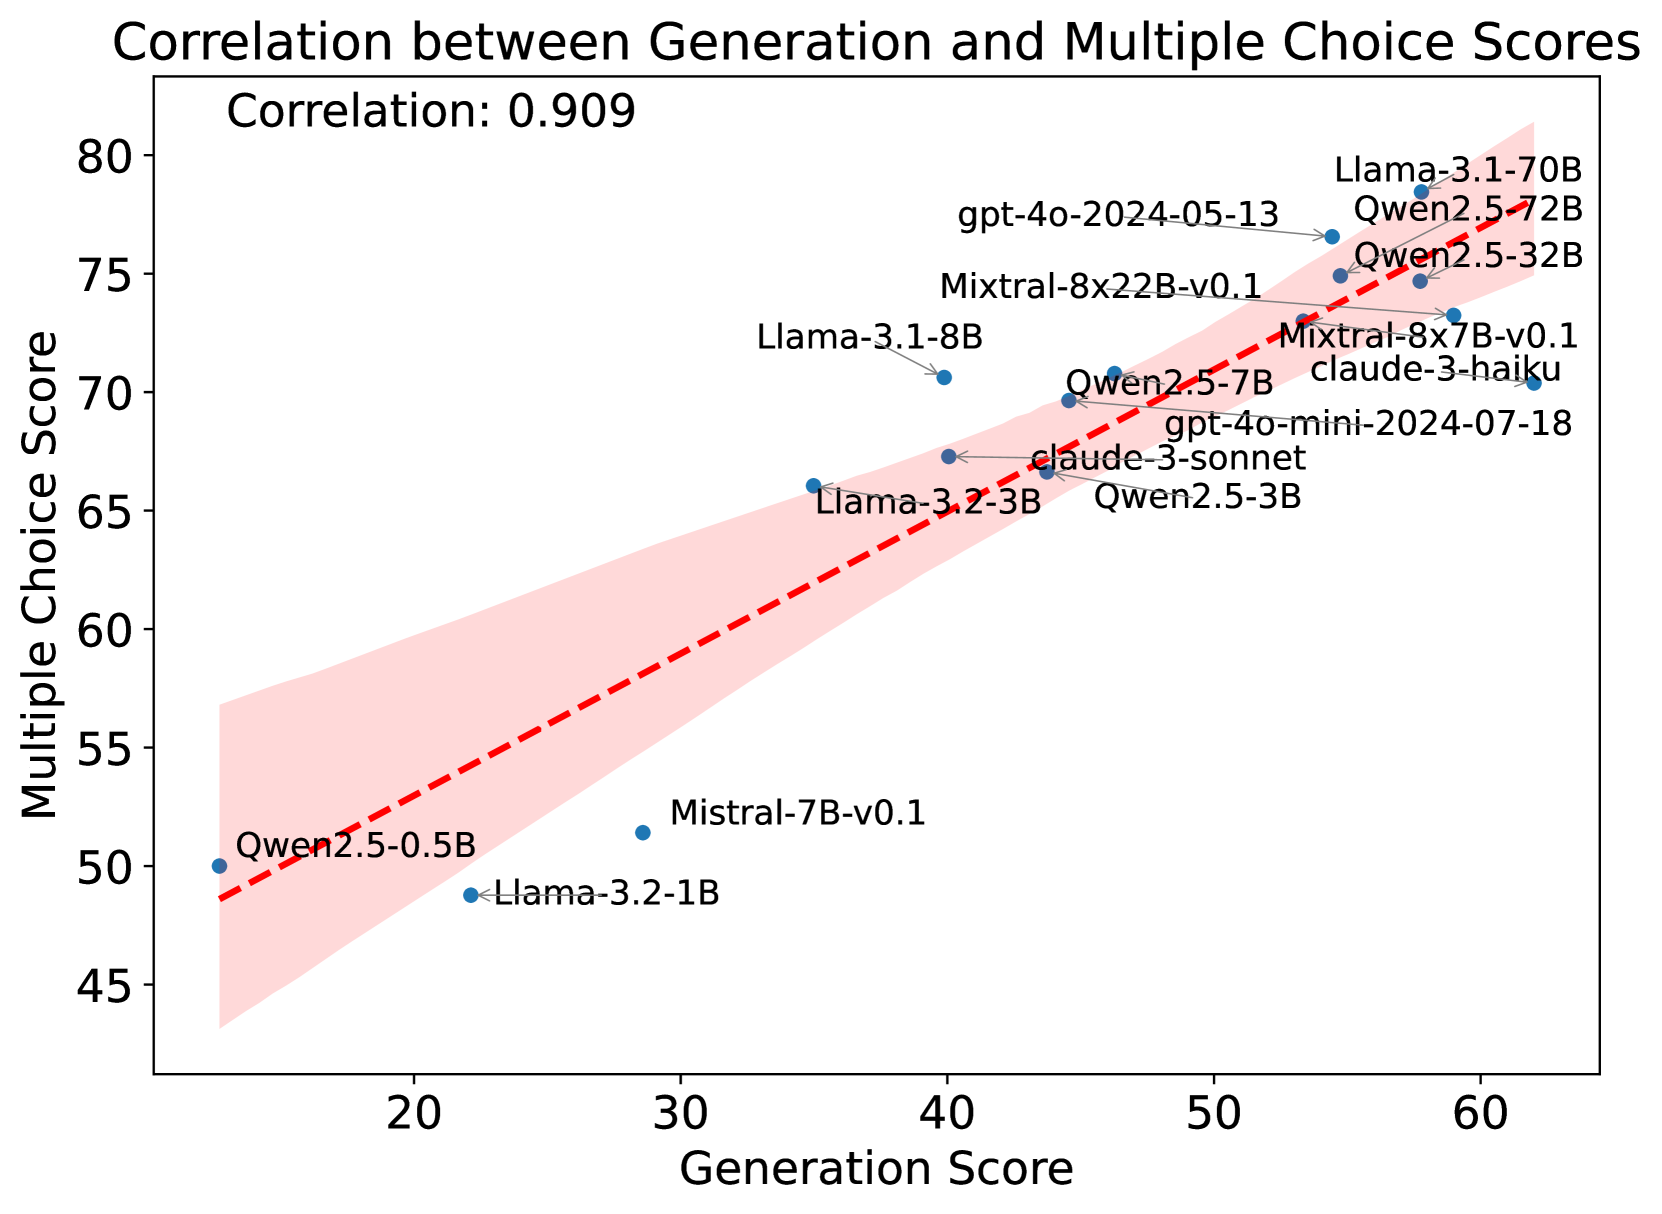
This image is a scatter plot visualizing the relationship between two performance metrics for various large language models (LLMs). The chart demonstrates a strong positive correlation between a model's "Generation Score" and its "Multiple Choice Score." A red dashed trend line with a pink shaded confidence interval is overlaid on the data points.
### Components/Axes
* **Chart Title:** "Correlation between Generation and Multiple Choice Scores"
* **Correlation Coefficient:** "Correlation: 0.909" (displayed in the top-left corner of the plot area).
* **X-Axis:** Labeled "Generation Score". The scale runs from approximately 15 to 65, with major tick marks at 20, 30, 40, 50, and 60.
* **Y-Axis:** Labeled "Multiple Choice Score". The scale runs from approximately 45 to 80, with major tick marks at 45, 50, 55, 60, 65, 70, 75, and 80.
* **Data Series:** Individual blue dots represent specific LLMs. Each dot is labeled with the model's name.
* **Trend Line:** A red dashed line indicating the linear regression fit for the data.
* **Confidence Interval:** A pink shaded region surrounding the trend line, representing the uncertainty or spread of the correlation.
### Detailed Analysis
The plot contains 16 data points, each corresponding to a named AI model. The approximate coordinates (Generation Score, Multiple Choice Score) for each model, read from the chart, are as follows. Values are approximate due to visual estimation.
1. **Qwen2.5-0.5B:** (~15, ~50) - Located at the extreme lower-left.
2. **Llama-3.2-1B:** (~22, ~49) - Slightly to the right and below the previous point.
3. **Mistral-7B-v0.1:** (~29, ~51.5) - Positioned below the trend line.
4. **Llama-3.2-3B:** (~35, ~66) - Positioned above the trend line.
5. **Llama-3.1-8B:** (~40, ~70.5) - Positioned above the trend line.
6. **Qwen2.5-3B:** (~43, ~67) - Positioned near the trend line.
7. **claude-3-sonnet:** (~44, ~67) - Positioned near the trend line, slightly right of Qwen2.5-3B.
8. **Qwen2.5-7B:** (~46, ~69.5) - Positioned near the trend line.
9. **gpt-4o-mini-2024-07-18:** (~47, ~69) - Positioned near the trend line.
10. **Mixtral-8x7B-v0.1:** (~53, ~73) - Positioned near the trend line.
11. **claude-3-haiku:** (~54, ~73) - Positioned near the trend line, slightly right of Mixtral-8x7B-v0.1.
12. **Mixtral-8x22B-v0.1:** (~55, ~75) - Positioned near the trend line.
13. **gpt-4o-2024-05-13:** (~56, ~76.5) - Positioned near the trend line.
14. **Qwen2.5-32B:** (~58, ~74.5) - Positioned slightly below the trend line.
15. **Qwen2.5-72B:** (~59, ~75) - Positioned near the trend line.
16. **Llama-3.1-70B:** (~60, ~78) - Located at the extreme upper-right, the highest scoring model on both axes.
**Trend Verification:** The data series shows a clear upward slope from the lower-left to the upper-right. As the Generation Score increases, the Multiple Choice Score consistently increases, confirming the strong positive correlation of 0.909.
### Key Observations
1. **Strong Linear Relationship:** The high correlation coefficient (0.909) and the tight clustering of points around the trend line indicate a very strong positive linear relationship between the two scoring metrics.
2. **Performance Clustering:** Models naturally cluster into performance tiers. Smaller models (e.g., Qwen2.5-0.5B, Llama-3.2-1B) occupy the lower-left quadrant, while larger, more capable models (e.g., Llama-3.1-70B, Qwen2.5-72B) dominate the upper-right.
3. **Notable Outliers:**
* **Mistral-7B-v0.1** is a clear outlier, sitting significantly below the trend line. This suggests its Multiple Choice Score is lower than what would be predicted by its Generation Score.
* **Llama-3.2-3B** and **Llama-3.1-8B** are positioned noticeably above the trend line, indicating their Multiple Choice performance is higher than predicted by their Generation scores.
4. **Model Families:** Models from the same family (e.g., Qwen2.5 series, Llama-3.x series) generally follow the same trend, with performance scaling with model size (parameter count).
### Interpretation
This chart provides a Peircean insight into the nature of LLM evaluation. The strong correlation suggests that the "Generation Score" and "Multiple Choice Score" are not measuring entirely independent capabilities. Instead, they likely tap into a common underlying factor of general model capability or "intelligence." A model that is good at one type of task (open-ended generation) is very likely to be good at the other (structured multiple-choice reasoning).
The outliers are particularly informative. Models like **Mistral-7B-v0.1** that underperform on multiple choice relative to their generation ability might have strengths in creative or fluid tasks but weaknesses in precise, knowledge-based recall or logical deduction required for multiple-choice questions. Conversely, models like **Llama-3.2-3B** that overperform might be exceptionally well-calibrated for test-taking or have been fine-tuned heavily on similar question formats.
The chart effectively argues that for these models and these specific benchmarks, a single metric might be a reasonable proxy for overall performance, as the two scores are highly redundant. However, the outliers caution against over-reliance on a single number, as individual models can have distinct capability profiles. The pink confidence interval visually reinforces the reliability of this trend across the evaluated model spectrum.